| Age Group | Licensed Drivers | Percent of Licensed Drivers | Drivers in a Crash | Percent of Drivers in a Crash | Drivers in Fatal Crashes | Drivers in Injury Crashes | Drivers in Property Damage Crashes |
|---|---|---|---|---|---|---|---|
| 0-4 | - | - | - | - | - | - | - |
| 5-14 | - | - | 185 | 0.1% | 3 | 60 | 122 |
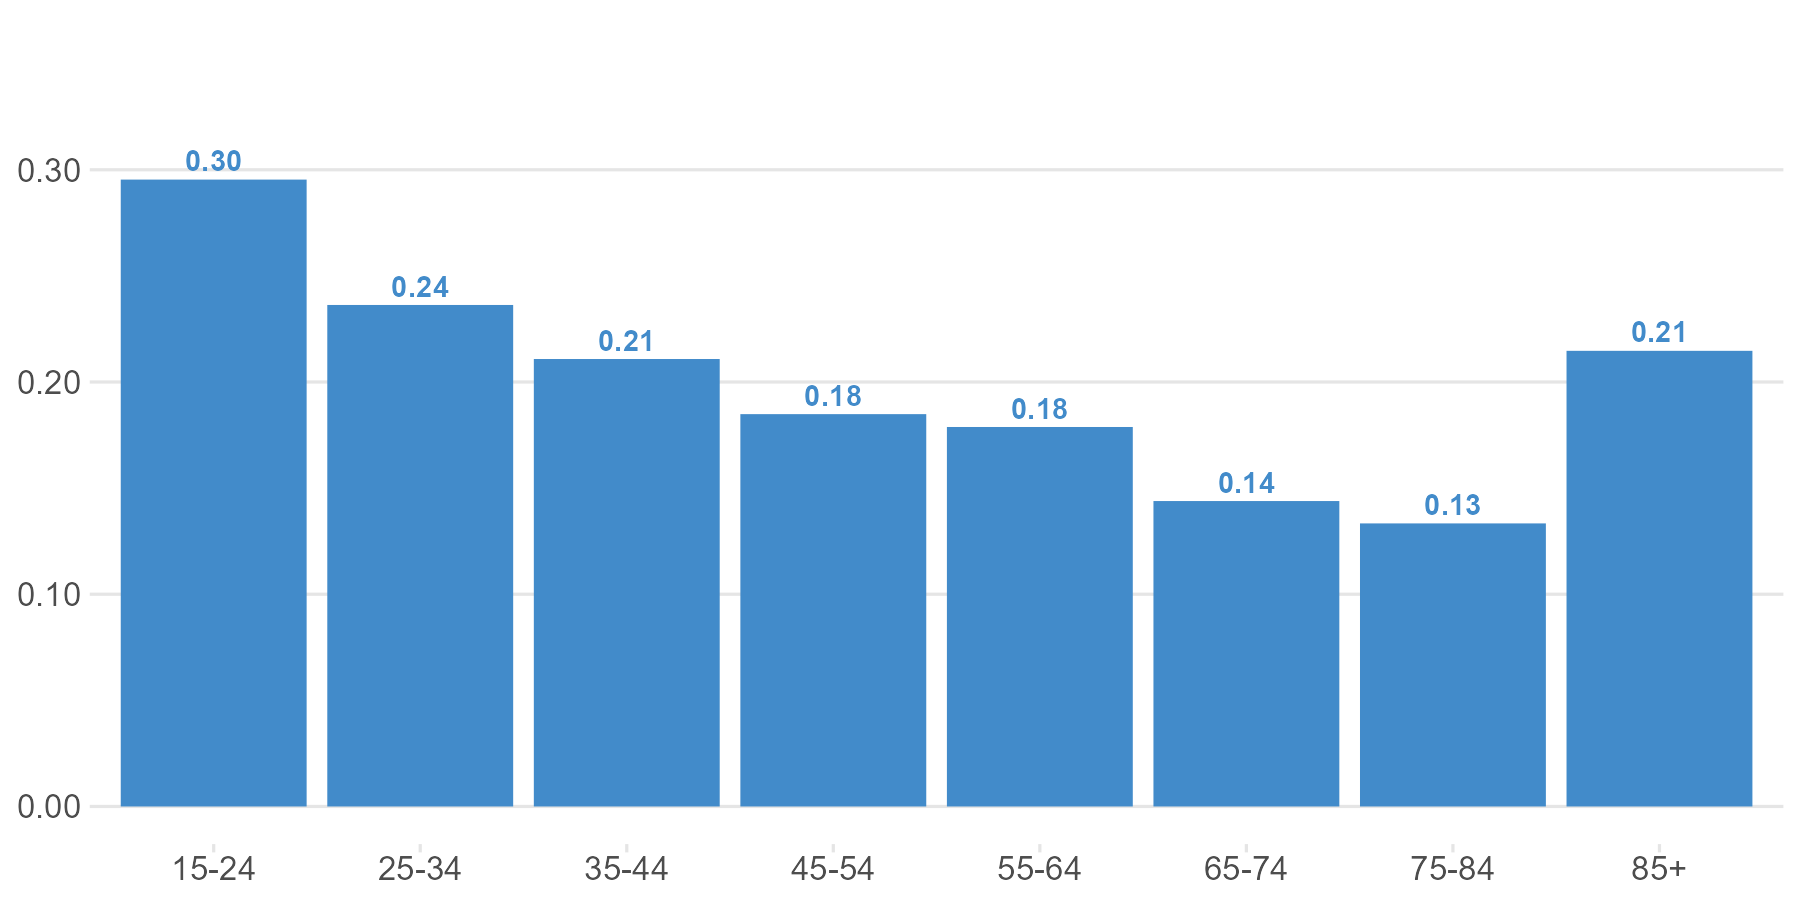
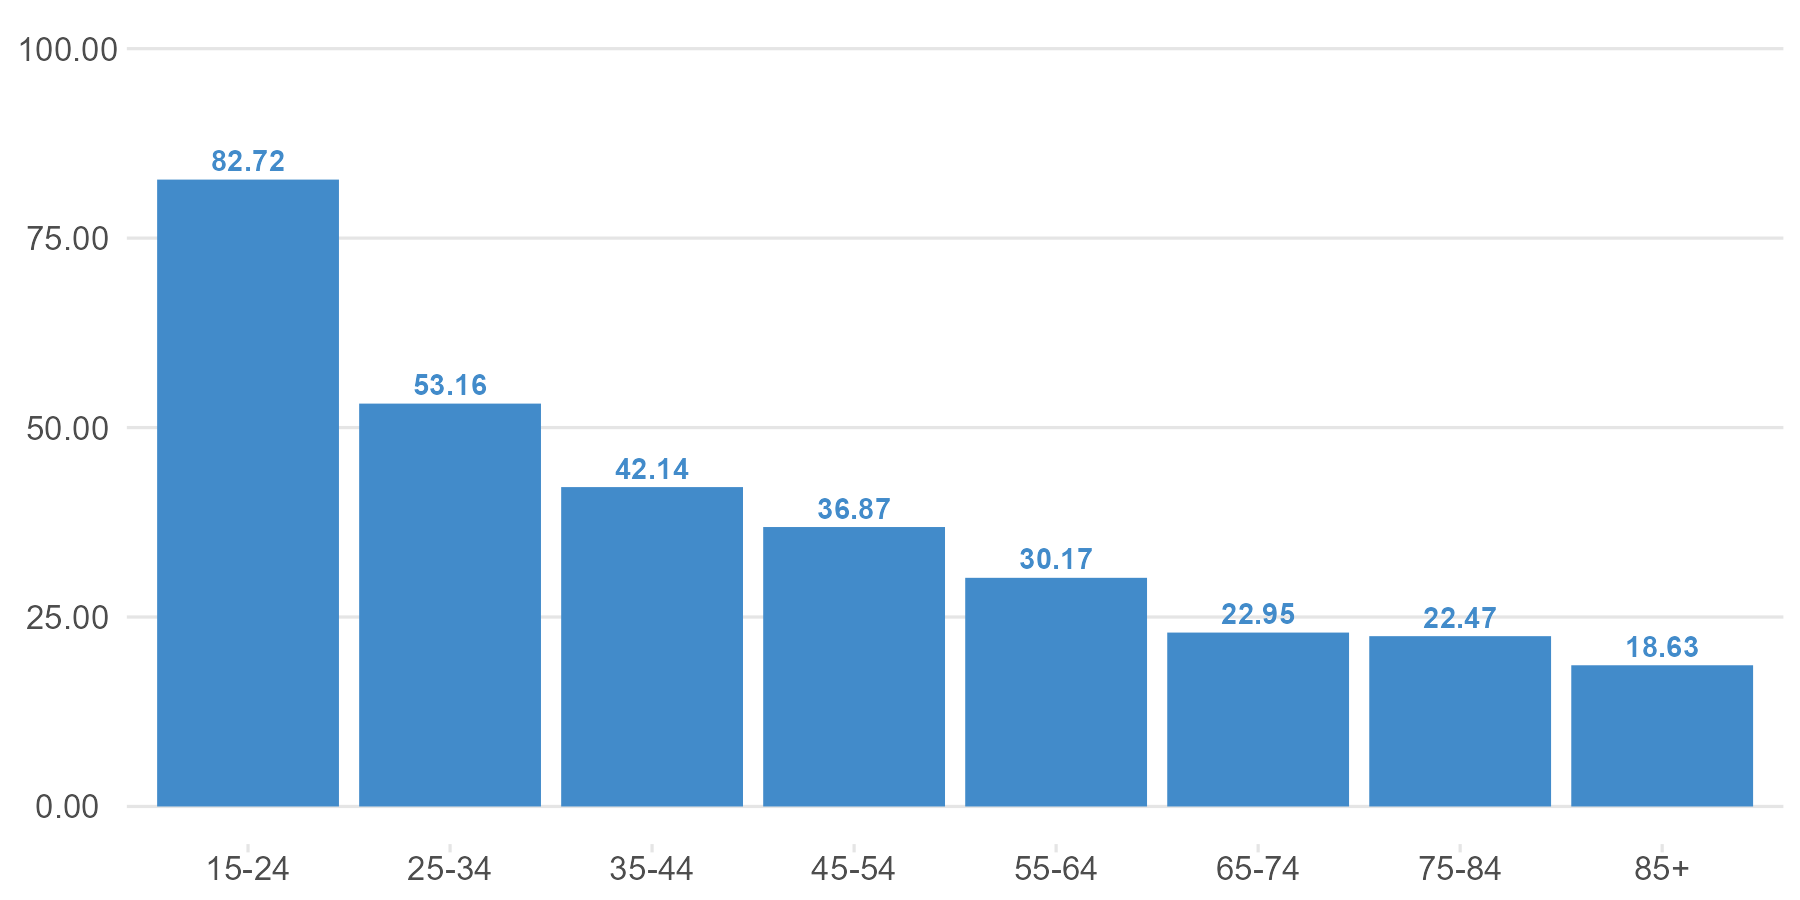
| 15-24 | 524,753 | 12.0% | 43,408 | 22.1% | 155 | 10,287 | 32,966 |
| 25-34 | 706,721 | 16.2% | 37,570 | 19.1% | 167 | 9,289 | 28,114 |
| 35-44 | 706,709 | 16.2% | 29,784 | 15.1% | 149 | 7,106 | 22,529 |
| 45-54 | 654,544 | 15.0% | 24,136 | 12.3% | 121 | 5,783 | 18,232 |
| 55-64 | 777,366 | 17.8% | 23,455 | 11.9% | 139 | 5,468 | 17,848 |
| 65-74 | 618,431 | 14.2% | 14,192 | 7.2% | 89 | 3,381 | 10,722 |
| 75-84 | 284,910 | 6.5% | 6,403 | 3.3% | 38 | 1,521 | 4,844 |
| 85+ | 88,497 | 2.0% | 1,649 | 0.8% | 19 | 412 | 1,218 |
| Unknown | - | - | 16,060 | 8.2% | 11 | 1,617 | 14,432 |
| Total | 4,361,931 | - | 196,842 | - | 891 | 44,924 | 151,027 |
| Licensed drivers do not include 15-year olds as licensed drivers are made up of Valid (Valid D and Probationary) and Withdrawn (Revoked/Suspended/Canceled/Surrendered/Disqualified) license holders. | |||||||
3 Drivers
Note
This section looks at all drivers in a crash and excludes bicyclists and pedestrians. These numbers do not represent the number of crashes.
3.1 Driver Demographics
Note
Crash rate is drivers in a crash per 1,000 licensed drivers.
| Age Group | Male | ||||||
|---|---|---|---|---|---|---|---|
| Licensed Drivers | Percent of Licensed Drivers | Drivers in a Crash | Percent of Drivers in a Crash | Drivers in Fatal Crashes | Drivers in Injury Crashes | Drivers in Property Damage Crashes | |
| 0-4 | - | - | - | - | - | - | - |
| 5-14 | - | - | 59 | 0.1% | 3 | 35 | 88 |
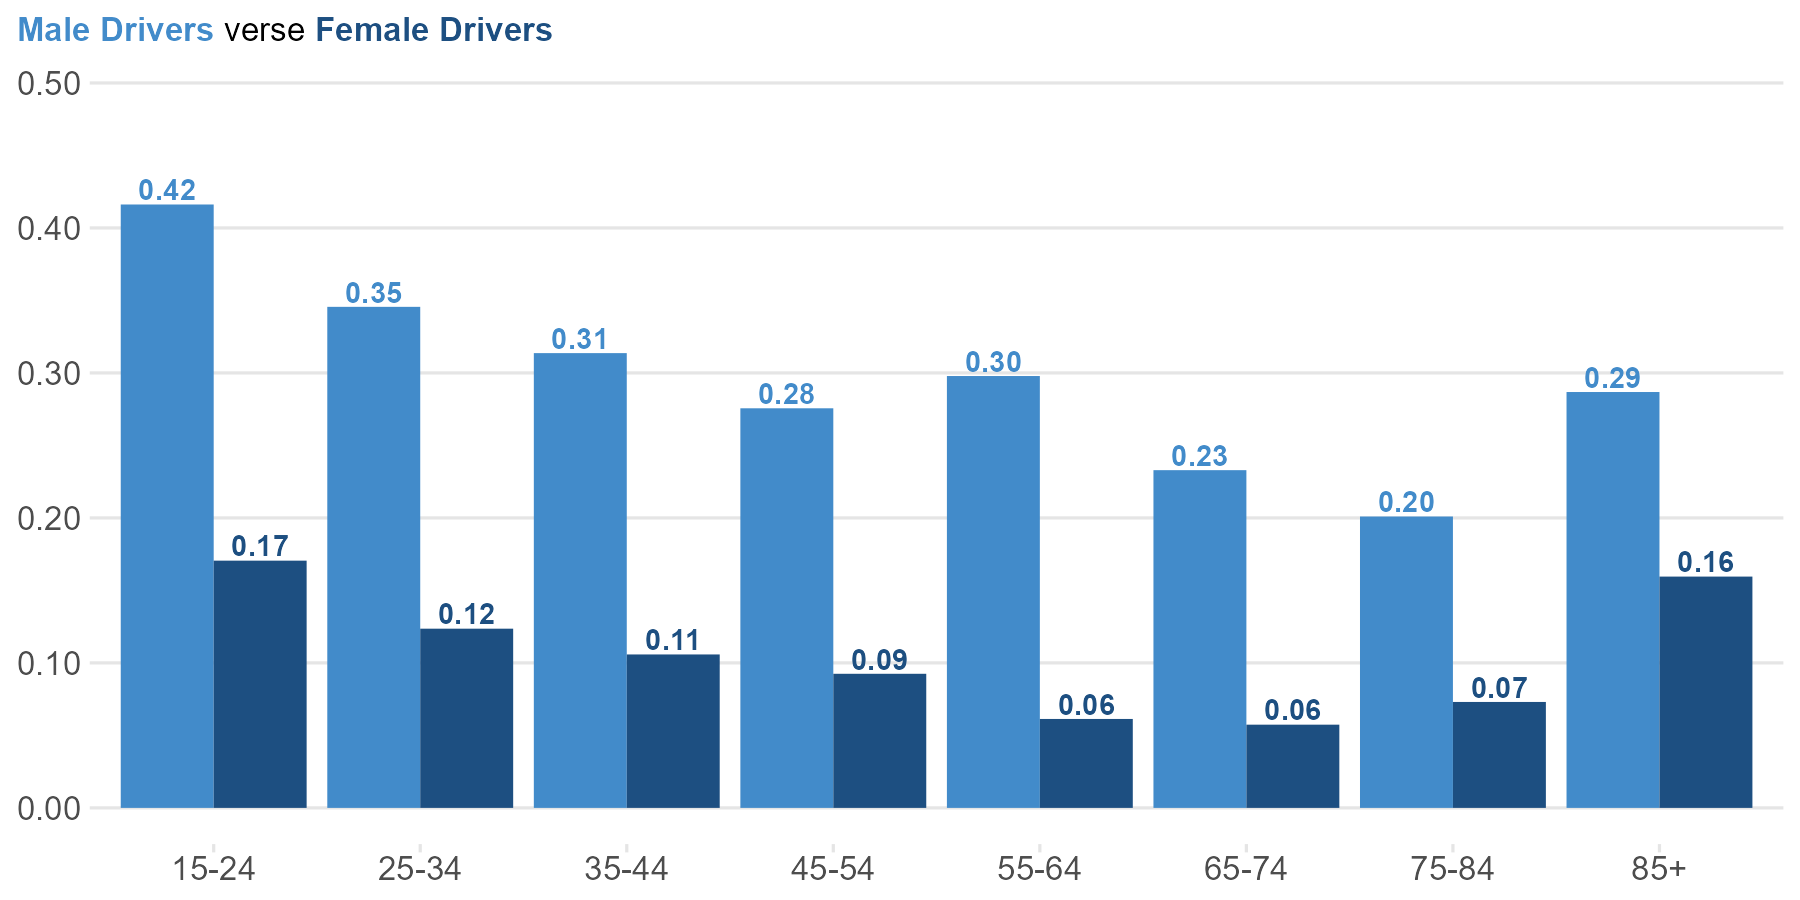
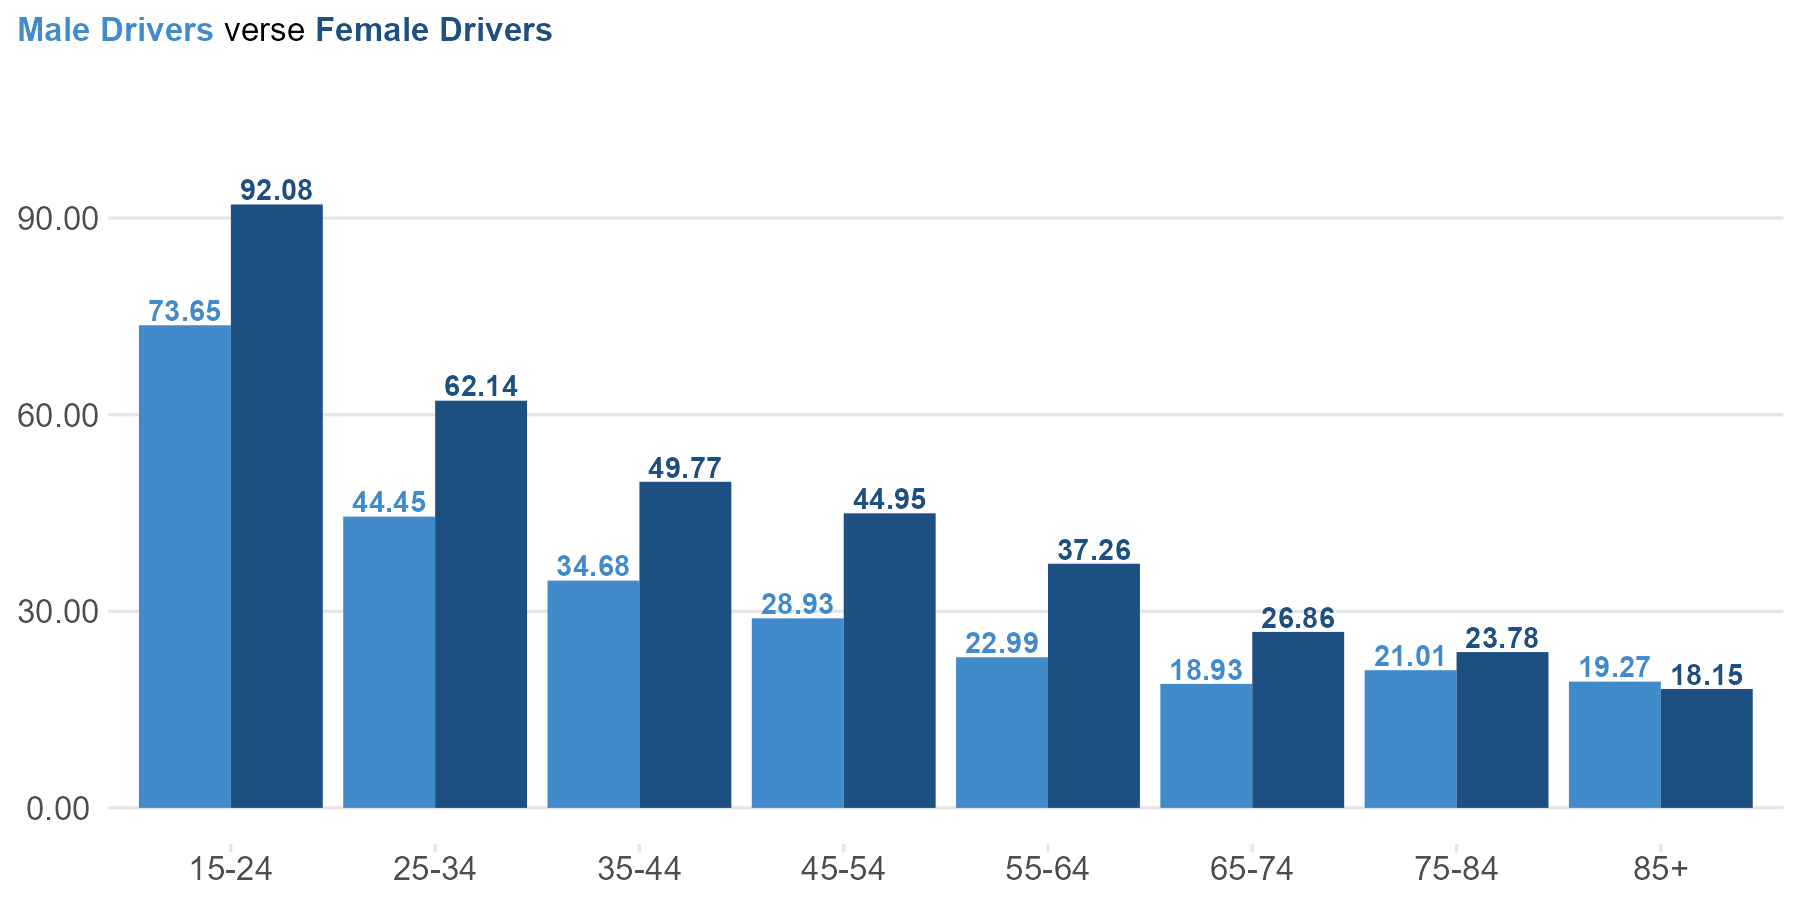
| 15-24 | 266,716 | 12.3% | 19,644 | 25.9% | 111 | 5,601 | 18,048 |
| 25-34 | 358,819 | 16.5% | 15,949 | 21.0% | 124 | 5,242 | 16,252 |
| 35-44 | 357,073 | 16.4% | 12,384 | 16.3% | 112 | 3,969 | 13,319 |
| 45-54 | 330,180 | 15.2% | 9,551 | 12.6% | 91 | 3,364 | 11,126 |
| 55-64 | 386,082 | 17.7% | 8,876 | 11.7% | 115 | 3,402 | 11,062 |
| 65-74 | 304,808 | 14.0% | 5,769 | 7.6% | 71 | 1,983 | 6,369 |
| 75-84 | 134,351 | 6.2% | 2,823 | 3.7% | 27 | 848 | 2,705 |
| 85+ | 38,350 | 1.8% | 739 | 1.0% | 11 | 232 | 667 |
| Unknown | - | - | 76 | 0.1% | - | 39 | 215 |
| Total | 2,176,379 | - | 75,870 | - | 665 | 24,715 | 79,851 |
| Licensed drivers do not include 15-year olds as licensed drivers are made up of Valid (Valid D and Probationary) and Withdrawn (Revoked/Suspended/Canceled/Surrendered/Disqualified) license holders. | |||||||
| Age Group | Female | ||||||
|---|---|---|---|---|---|---|---|
| Licensed Drivers | Percent of Licensed Drivers | Drivers in a Crash | Percent of Drivers in a Crash | Drivers in Fatal Crashes | Drivers in Injury Crashes | Drivers in Property Damage Crashes | |
| 0-4 | - | - | - | - | - | - | - |
| 5-14 | - | - | 126 | 0.1% | - | 25 | 34 |
| 15-24 | 258,037 | 11.8% | 23,760 | 22.6% | 44 | 4,686 | 14,914 |
| 25-34 | 347,902 | 15.9% | 21,618 | 20.5% | 43 | 4,046 | 11,860 |
| 35-44 | 349,636 | 16.0% | 17,400 | 16.5% | 37 | 3,137 | 9,210 |
| 45-54 | 324,364 | 14.8% | 14,581 | 13.9% | 30 | 2,418 | 7,103 |
| 55-64 | 391,284 | 17.9% | 14,579 | 13.9% | 24 | 2,066 | 6,786 |
| 65-74 | 313,623 | 14.3% | 8,423 | 8.0% | 18 | 1,398 | 4,353 |
| 75-84 | 150,559 | 6.9% | 3,580 | 3.4% | 11 | 673 | 2,139 |
| 85+ | 50,147 | 2.3% | 910 | 0.9% | 8 | 180 | 551 |
| Unknown | - | - | 254 | 0.2% | - | 16 | 60 |
| Total | 2,185,552 | - | 105,231 | - | 215 | 18,645 | 57,010 |
| Licensed drivers do not include 15-year olds as licensed drivers are made up of Valid (Valid D and Probationary) and Withdrawn (Revoked/Suspended/Canceled/Surrendered/Disqualified) license holders. | |||||||
3.2 Driver Behavior
| What driver was doing | Fatal | Injury | Property Damage | Total |
|---|---|---|---|---|
| Accelerating In Road | 5 | 287 | 575 | 867 |
| Backing | 5 | 375 | 8,893 | 9,273 |
| Changing Lanes | 9 | 631 | 3,284 | 3,924 |
| Disabled or Parked In Traffic Lane | 1 | 26 | 58 | 85 |
| Entering Traffic Lane | 7 | 378 | 1,302 | 1,687 |
| Going Straight | 540 | 26,286 | 63,398 | 90,224 |
| Illegally Parked | 1 | 39 | 244 | 284 |
| Leaving A Parked Position | 3 | 92 | 858 | 953 |
| Leaving Traffic Lane | 14 | 183 | 499 | 696 |
| Left Turn | 53 | 4,800 | 11,006 | 15,859 |
| Legally Parked | 2 | 47 | 230 | 279 |
| Merging | 1 | 118 | 606 | 725 |
| Negotiating Curve | 148 | 2,547 | 6,560 | 9,255 |
| Other | 15 | 383 | 1,252 | 1,650 |
| Overtake Left | 11 | 244 | 870 | 1,125 |
| Overtake Right | 4 | 111 | 531 | 646 |
| Park Maneuver | 1 | 84 | 1,563 | 1,648 |
| Right Turn | 5 | 1,212 | 6,460 | 7,677 |
| Slow/Stopping | 16 | 2,866 | 8,392 | 11,274 |
| Starting In Road | 3 | 135 | 297 | 435 |
| Stop In Traffic | 13 | 2,455 | 5,598 | 8,066 |
| Turn On Red | - | 14 | 36 | 50 |
| U Turn | 3 | 257 | 772 | 1,032 |
| Unknown | 31 | 1,329 | 27,680 | 29,040 |
| Viol No Passs Zn | - | 25 | 63 | 88 |
| Total | 891 | 44,924 | 151,027 | 196,842 |
| This does not include what pedestrians or bicyclists were doing. | ||||
| Driver's Condition | Fatal | Injury | Property Damage | Total |
|---|---|---|---|---|
| Appeared Normal | 367 | 37,119 | 106,708 | 144,194 |
| Asleep or Fatigued | 3 | 425 | 644 | 1,072 |
| Blind | - | 1 | 3 | 4 |
| Confused or Disoriented (Non Lucid) | 11 | 846 | 470 | 1,327 |
| Emotional (Depressed, Angry, Disturbed, Etc) | 7 | 671 | 693 | 1,371 |
| Ill (Sick), Fainted | 3 | 277 | 219 | 499 |
| Not Observed | 366 | 3,586 | 23,517 | 27,469 |
| Other | 85 | 308 | 279 | 672 |
| Paraplegic or Restricted To Wheelchair | - | 9 | 5 | 14 |
| Physically Impaired | 17 | 623 | 610 | 1,250 |
| Under The Influence Of Medications/Drugs/Alcohol | 50 | 2,126 | 3,064 | 5,240 |
| Using Cane or Crutches | - | 27 | 64 | 91 |
| Total | 909 | 46,018 | 136,276 | 183,203 |
| A person may have one or more conditions. | ||||
| Month | Killed | Injured | No Injury | Total | ||||||
|---|---|---|---|---|---|---|---|---|---|---|
| Wisconsin | Out-of-State | Unknown/No License | Wisconsin | Out-of-State | Unknown/No License | Wisconsin | Out-of-State | Unknown/No License | ||
| January | 22 | 3 | - | 1,612 | 92 | 11 | 11,317 | 876 | 1,505 | 15,438 |
| February | 15 | - | 2 | 1,657 | 115 | 18 | 13,264 | 1,052 | 1,554 | 17,677 |
| March | 14 | - | - | 1,501 | 104 | 19 | 8,821 | 657 | 1,257 | 12,373 |
| April | 29 | 2 | - | 1,718 | 91 | 25 | 9,312 | 683 | 1,392 | 13,252 |
| May | 41 | 5 | 1 | 2,037 | 142 | 35 | 11,430 | 958 | 1,510 | 16,159 |
| June | 40 | 2 | - | 2,345 | 181 | 24 | 12,083 | 1,142 | 1,493 | 17,310 |
| July | 43 | 1 | 1 | 2,084 | 201 | 34 | 11,002 | 1,271 | 1,547 | 16,184 |
| August | 49 | 6 | - | 2,195 | 191 | 29 | 11,251 | 1,126 | 1,567 | 16,414 |
| September | 57 | 4 | 2 | 2,092 | 165 | 24 | 12,096 | 1,054 | 1,365 | 16,859 |
| October | 49 | 4 | 1 | 2,076 | 140 | 26 | 13,333 | 1,181 | 1,517 | 18,327 |
| November | 16 | 2 | - | 1,782 | 121 | 29 | 13,007 | 1,041 | 1,354 | 17,352 |
| December | 26 | 3 | - | 2,031 | 146 | 20 | 14,621 | 1,205 | 1,445 | 19,497 |
| Total | 401 | 32 | 7 | 23,130 | 1,689 | 294 | 141,537 | 12,246 | 17,506 | 196,842 |
Note
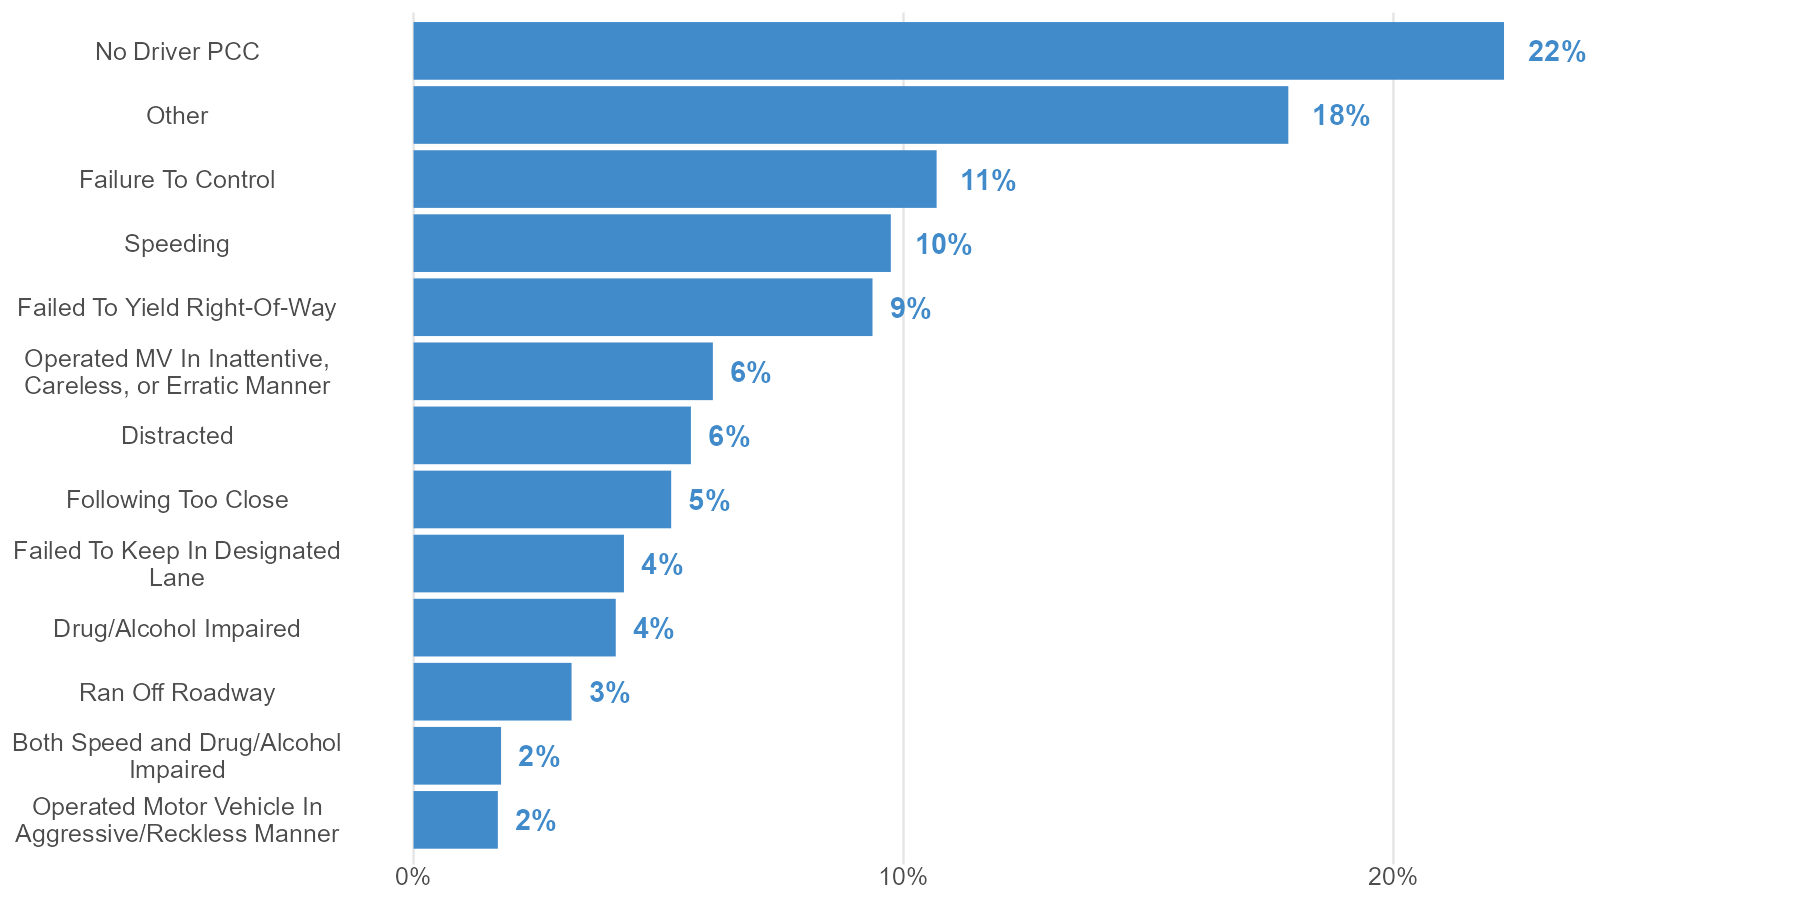
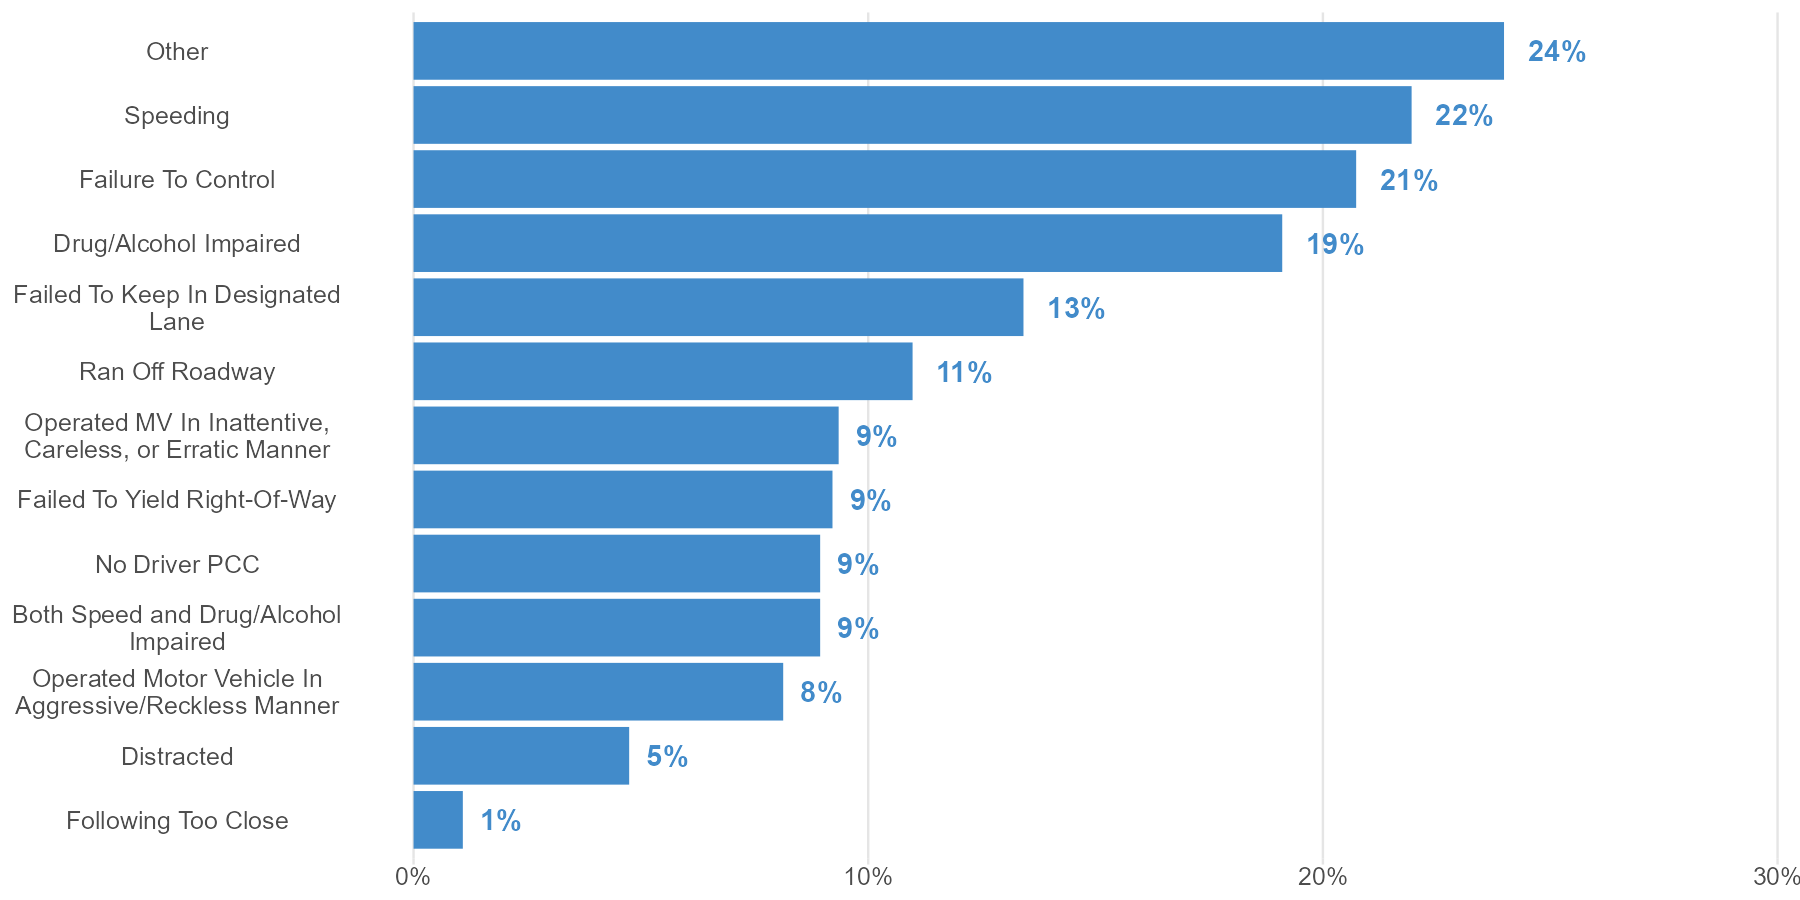
These two charts count Driver Possible Contributing Circumstances (PCCs) marked on the crash report form as well as if speed, drug/alcohol impairment, and distraction was also a factor. It does not address contributing factors on the part of bicyclists or pedestrians. It counts multiple PCCs per crash and removes ‘Unknown’ causes. The tables are at the crash level and there can be multiple factors in a crash.
| PCC | Fatal | Injury | Property Damage | Total |
|---|---|---|---|---|
| Disregarded Other Road Markings | 5 | 164 | 397 | 566 |
| Disregarded Other Traffic Control | 7 | 296 | 566 | 869 |
| Disregarded Red Light | 12 | 1,343 | 1,621 | 2,976 |
| Disregarded Stop Sign | 36 | 934 | 1,181 | 2,151 |
| Exceed Speed Limit | 120 | 1,591 | 2,046 | 3,757 |
| Failed To Keep In Designated Lane | 99 | 2,159 | 5,578 | 7,836 |
| Failed To Yield Right-Of-Way | 68 | 5,859 | 11,029 | 16,956 |
| Failure To Control | 154 | 5,628 | 13,533 | 19,315 |
| Following Too Close | 9 | 2,525 | 7,080 | 9,614 |
| Improper Overtaking / Passing Left | 16 | 230 | 739 | 985 |
| Improper Overtaking / Passing Right | 2 | 150 | 527 | 679 |
| Improper Turn | 4 | 450 | 2,406 | 2,860 |
| Looked But Did Not See | 18 | 1,673 | 6,661 | 8,352 |
| Operated Motor Vehicle In Aggressive/Reckless Manner | 61 | 1,146 | 2,119 | 3,326 |
| Operated Motor Vehicle In Inattentive, Careless, Negligent, or Erratic Manner | 69 | 3,430 | 7,640 | 11,139 |
| Other Contributing Action | 37 | 2,010 | 5,579 | 7,626 |
| Over-Correcting/Over-Steering | 23 | 483 | 892 | 1,398 |
| Racing | 5 | 38 | 55 | 98 |
| Ran Off Roadway | 81 | 2,005 | 3,750 | 5,836 |
| Speed Too Fast/Cond | 74 | 2,366 | 7,157 | 9,597 |
| Swerved or Avoided Due To Wind, Slippery Surface, Motor Vehicle, Object, Non-Motorist In Rdwy, Etc. | 12 | 338 | 868 | 1,218 |
| Unknown | 165 | 3,226 | 18,362 | 21,753 |
| Unsafe Backing | 3 | 212 | 5,099 | 5,314 |
| Wrong Side or Wrong Way | 31 | 395 | 618 | 1,044 |
| Total | 1,111 | 38,651 | 105,503 | 145,265 |
| The numbers in this table represent the number of times a driver was cited as a possible contributing circumstance (PCC) in a crash. The numbers do not represent numbers of crashes or drivers. | ||||
| Crash Severity | Crash w/ PCC | Total crashes | Share |
|---|---|---|---|
| Fatal | 506 | 546 | 93% |
| Injury | 23,422 | 26,209 | 89% |
| Property Damage | 75,048 | 101,541 | 74% |
| Total | 98,976 | 128,296 | 77% |
Top Five Citations Issued to Drivers by Crash Severity
| Citation | # of Citations |
|---|---|
| Operate Motor Vehicle W/O Insurance | 13 |
| Failure To Keep Vehicle Under Control | 12 |
| Inattentive Driving | 12 |
| Operating While Under The Influence | 11 |
| Homicide By Intox. Use/Vehicle | 10 |
| For fatal crashes, if the driver was killed, then the driver would not have been issued any citations. Citations issued would be to the surviving driver. | |
| Citation | # of Citations |
|---|---|
| Operate Motor Vehicle W/O Insurance | 2,981 |
| Failure To Keep Vehicle Under Control | 2,373 |
| Inattentive Driving | 2,128 |
| Automobile Following Too Closely | 1,416 |
| Operating While Suspended | 1,307 |
| Citation | # of Citations |
|---|---|
| Operate Motor Vehicle W/O Insurance | 6,061 |
| Failure To Keep Vehicle Under Control | 4,897 |
| Inattentive Driving | 4,412 |
| Automobile Following Too Closely | 3,707 |
| Operating While Suspended | 2,563 |