| Vehicle Type | Fatal | Injury | Property Damage | Total |
|---|---|---|---|---|
| Passenger Car | 335 | 24,454 | 91,344 | 116,133 |
| (Sport) Utility Vehicle | 175 | 11,170 | 39,260 | 50,605 |
| Utility Truck/Pickup Truck | 129 | 5,135 | 21,548 | 26,812 |
| Passenger Van | 29 | 1,686 | 5,994 | 7,709 |
| Truck Tractor (Trailer Attached) | 51 | 738 | 3,514 | 4,303 |
| Straight Truck | 36 | 499 | 2,380 | 2,915 |
| Motorcycle | 120 | 1,621 | 401 | 2,142 |
| Cargo Van (10,000 Lbs or Less) | 6 | 338 | 1,187 | 1,531 |
| Bicycle | 9 | 602 | 89 | 700 |
| Passenger Bus/Transit Bus | 4 | 99 | 290 | 393 |
| School Bus | 1 | 66 | 303 | 370 |
| Snow Plow | 1 | 37 | 294 | 332 |
| POLICE ON EMERGENCY | 1 | 65 | 222 | 288 |
| AgCMV (Ag Commercial Motor Vehicle) | 2 | 61 | 192 | 255 |
| Farm Tractor/Self Propelled | 5 | 57 | 85 | 147 |
| Moped | 1 | 105 | 20 | 126 |
| Truck Tractor (Trailer Not Attached) | 3 | 24 | 69 | 96 |
| Other Working Machine | - | 25 | 69 | 94 |
| Motor Home | 2 | 10 | 75 | 87 |
| Ambulance On Emergency | - | 9 | 71 | 80 |
| Truck Tractor (More Than One Trailer) | - | 13 | 49 | 62 |
| Fire Truck On Emergency | - | 5 | 48 | 53 |
| Trailer | - | 11 | 39 | 50 |
| ATV/UTV (Utility Terrain Vehicle) | 2 | 17 | 29 | 48 |
| Railway Train | - | 13 | 31 | 44 |
| Horse and Buggy | 5 | 18 | 19 | 42 |
| Autocycle | - | 9 | 12 | 21 |
| Low Speed Vehicle | - | 2 | 19 | 21 |
| Motor Coach | - | 2 | 19 | 21 |
| Pupil Transportation School Bus | - | 4 | 17 | 21 |
| Miscellaneous | - | 10 | 10 | 20 |
| Fire Fighter On Emergency | - | 5 | 14 | 19 |
| Snowmobile | 1 | 7 | 7 | 15 |
| Other Bus | - | 1 | 7 | 8 |
| Mini Bike/Dirt Bike | 3 | 3 | - | 6 |
| Golf Cart | - | 2 | 3 | 5 |
| Total | 921 | 46,923 | 167,730 | 215,574 |
| This table counts all vehicles in reportable crashes except pedestrians. These numbers do not represent crashes. Because only crashes that involve a motor vehicle on a public roadway are included, this report does not accurately reflect the volume of bicycle, all-terrain vehicle, or snowmobile crashes in Wisconsin or even on Wisconsin public roads. A fire fighter on emergency is a fire fighter or emergency medical technician / first responder (paid or volunteer) who is responding to an emergency summons using a vehicle not owned by a fire fighting or emergency agency. | ||||
4 Vehicles/Units
4.1 All Vehicles
| County | Passenger Vehicle | Motorcycle/Moped | CMV | School Bus | Pedestrian | Bicycle | Other | Total |
|---|---|---|---|---|---|---|---|---|
| Adams | 481 | 17 | 17 | 1 | 3 | 3 | 14 | 536 |
| Ashland | 406 | 5 | 8 | - | 1 | - | 1 | 421 |
| Barron | 1,012 | 14 | 32 | 3 | 5 | 1 | 12 | 1,079 |
| Bayfield | 309 | 10 | 7 | - | - | - | 5 | 331 |
| Brown | 6,063 | 74 | 205 | 10 | 53 | 23 | 61 | 6,489 |
| Buffalo | 274 | 17 | 9 | 1 | - | - | 3 | 304 |
| Burnett | 334 | 13 | 6 | 1 | - | - | 9 | 363 |
| Calumet | 1,072 | 19 | 38 | - | 3 | 3 | 13 | 1,148 |
| Chippewa | 1,747 | 34 | 64 | 4 | 7 | 4 | 21 | 1,881 |
| Clark | 728 | 11 | 46 | 1 | 6 | - | 17 | 809 |
| Columbia | 2,066 | 27 | 168 | 5 | 13 | 2 | 22 | 2,303 |
| Crawford | 347 | 13 | 16 | - | 3 | 1 | 8 | 388 |
| Dane | 14,393 | 106 | 598 | 16 | 126 | 118 | 180 | 15,537 |
| Dodge | 2,096 | 36 | 99 | 7 | 10 | 6 | 39 | 2,293 |
| Door | 1,096 | 19 | 16 | 1 | 2 | 3 | 13 | 1,150 |
| Douglas | 1,413 | 20 | 31 | 2 | 6 | 5 | 11 | 1,488 |
| Dunn | 1,111 | 18 | 98 | 3 | 7 | 1 | 7 | 1,245 |
| Eau Claire | 3,666 | 38 | 171 | 10 | 18 | 14 | 30 | 3,947 |
| Florence | 116 | 2 | 3 | - | 1 | - | 3 | 125 |
| Fond du Lac | 4,063 | 50 | 148 | 8 | 27 | 20 | 31 | 4,347 |
| Forest | 224 | 5 | 10 | - | - | - | 4 | 243 |
| Grant | 1,755 | 20 | 65 | 3 | 5 | 9 | 30 | 1,887 |
| Green | 961 | 15 | 26 | 3 | 3 | 1 | 12 | 1,021 |
| Green Lake | 412 | 8 | 16 | - | 3 | 2 | 10 | 451 |
| Iowa | 688 | 15 | 43 | 2 | 2 | 1 | 5 | 756 |
| Iron | 113 | 5 | 3 | 1 | - | - | 2 | 124 |
| Jackson | 633 | 9 | 107 | - | - | - | 9 | 758 |
| Jefferson | 2,542 | 32 | 120 | 3 | 15 | 8 | 27 | 2,747 |
| Juneau | 892 | 18 | 132 | 2 | 2 | 3 | 16 | 1,065 |
| Kenosha | 7,238 | 78 | 252 | 4 | 43 | 25 | 53 | 7,693 |
| Kewaunee | 407 | 6 | 12 | - | - | - | 10 | 435 |
| La Crosse | 5,363 | 55 | 142 | 10 | 27 | 24 | 44 | 5,665 |
| Lafayette | 538 | 10 | 26 | 1 | 1 | 1 | 20 | 597 |
| Langlade | 607 | 9 | 14 | 2 | 3 | - | 6 | 641 |
| Lincoln | 904 | 23 | 31 | 2 | 3 | 1 | 8 | 972 |
| Manitowoc | 2,991 | 34 | 89 | 4 | 18 | 9 | 22 | 3,167 |
| Marathon | 4,435 | 47 | 141 | 10 | 24 | 14 | 50 | 4,721 |
| Marinette | 1,340 | 14 | 50 | 1 | 7 | 5 | 16 | 1,433 |
| Marquette | 403 | 12 | 10 | - | - | - | 7 | 432 |
| Menominee | 37 | 2 | - | - | - | - | - | 39 |
| Milwaukee | 50,746 | 315 | 1,300 | 95 | 526 | 152 | 496 | 53,630 |
| Monroe | 1,535 | 28 | 132 | 3 | 6 | 1 | 18 | 1,723 |
| Oconto | 751 | 19 | 24 | 1 | 4 | 2 | 10 | 811 |
| Oneida | 1,078 | 17 | 23 | 2 | 4 | - | 8 | 1,132 |
| Outagamie | 6,455 | 73 | 175 | 16 | 20 | 26 | 44 | 6,809 |
| Ozaukee | 2,497 | 26 | 96 | 6 | 9 | 13 | 22 | 2,669 |
| Pepin | 113 | 8 | 4 | - | 1 | - | - | 126 |
| Pierce | 719 | 30 | 22 | 2 | 6 | 1 | 5 | 785 |
| Polk | 872 | 24 | 27 | 3 | 4 | 1 | 15 | 946 |
| Portage | 2,189 | 27 | 106 | 6 | 6 | 8 | 27 | 2,369 |
| Price | 254 | 2 | 10 | - | - | 1 | - | 267 |
| Racine | 7,557 | 62 | 262 | 13 | 67 | 25 | 81 | 8,067 |
| Richland | 527 | 10 | 16 | 1 | 1 | - | 7 | 562 |
| Rock | 6,624 | 66 | 330 | 4 | 48 | 21 | 55 | 7,148 |
| Rusk | 250 | 4 | 8 | 1 | 4 | - | 8 | 275 |
| Sauk | 2,776 | 41 | 120 | 5 | 19 | 8 | 23 | 2,992 |
| Sawyer | 430 | 6 | 14 | - | 4 | - | 11 | 465 |
| Shawano | 1,255 | 26 | 49 | 7 | 8 | 2 | 20 | 1,367 |
| Sheboygan | 4,207 | 52 | 116 | 14 | 14 | 22 | 34 | 4,459 |
| St. Croix | 3,291 | 36 | 209 | 11 | 11 | 4 | 34 | 3,596 |
| Taylor | 557 | 8 | 21 | - | 4 | - | 9 | 599 |
| Trempealeau | 668 | 14 | 52 | 2 | 3 | - | 6 | 745 |
| Vernon | 546 | 14 | 19 | 3 | 2 | 1 | 18 | 603 |
| Vilas | 716 | 10 | 19 | 3 | 2 | 1 | 16 | 767 |
| Walworth | 3,223 | 60 | 130 | 8 | 21 | 2 | 30 | 3,474 |
| Washburn | 408 | 8 | 18 | 2 | 3 | - | 8 | 447 |
| Washington | 4,920 | 64 | 216 | 8 | 14 | 12 | 35 | 5,269 |
| Waukesha | 12,800 | 116 | 390 | 26 | 123 | 38 | 79 | 13,572 |
| Waupaca | 1,123 | 19 | 49 | 5 | 5 | - | 15 | 1,216 |
| Waushara | 677 | 27 | 49 | 2 | - | 2 | 14 | 771 |
| Winnebago | 5,795 | 69 | 231 | 15 | 31 | 39 | 32 | 6,212 |
| Wood | 1,955 | 29 | 70 | 6 | 8 | 11 | 17 | 2,096 |
| Total | 202,790 | 2,270 | 7,376 | 391 | 1,425 | 700 | 2,048 | 217,000 |
| Passenger vehicles are made up of passenger cars, sport utility vehicles, cargo vans (10,000 lbs or less), passenger vans, and utility trucks/pickup trucks. CMVs (commercial motor vehicle) are made up of straight trucks and truck tractors (whether a trailer is attached or not). | ||||||||
| Damage Severity | Fatal | Injury | Property Damage | Total | |||
|---|---|---|---|---|---|---|---|
| No | Yes | No | Yes | No | Yes | ||
| None | 17 | - | 1,771 | 2 | 6,184 | 21 | 7,995 |
| Minor | 61 | 2 | 7,674 | 131 | 56,574 | 462 | 64,904 |
| Functional | 71 | 15 | 8,492 | 1,270 | 49,545 | 2,570 | 61,963 |
| Disabling | 39 | 705 | 1,671 | 24,681 | 9,188 | 30,885 | 67,169 |
| Unknown | 11 | - | 1,223 | 8 | 12,261 | 41 | 13,544 |
| Total | 199 | 722 | 20,831 | 26,092 | 133,752 | 33,979 | 215,575 |
| The Yes/No categories here represent whether or not the vehicle needed to be towed following the crash due to disabling damage. These numberes represent vehicles, not crashes. | |||||||
| Vehicles Per Crash | Fatal | Injury | Property Damage | Total Crashes |
|---|---|---|---|---|
| 0. | - | - | - | - |
| 1 | 287 | 9,182 | 40,151 | 49,620 |
| 2 | 208 | 14,724 | 57,668 | 72,600 |
| 3 | 42 | 1,878 | 3,199 | 5,119 |
| 4 | 5 | 336 | 410 | 751 |
| 5 | 2 | 55 | 86 | 143 |
| 6 | 1 | 22 | 16 | 39 |
| 7 | - | 4 | 9 | 13 |
| 8 | - | 2 | 1 | 3 |
| 9 | - | 3 | - | 3 |
| 10 or more | 1 | 3 | 1 | 5 |
| Total | 546 | 26,209 | 101,541 | 128,296 |
| This table does not include pedestrians. | ||||
| Occupants in the Vehicle | Fatal | Injury | Property Damage | Total |
|---|---|---|---|---|
| Zero | 16 | 1,280 | 14,980 | 16,276 |
| 1 | 662 | 32,815 | 121,879 | 155,356 |
| 2 | 169 | 8,894 | 22,632 | 31,695 |
| 3 | 32 | 2,414 | 5,093 | 7,539 |
| 4 | 21 | 968 | 2,103 | 3,092 |
| 5 | 15 | 361 | 695 | 1,071 |
| 6 | 2 | 106 | 191 | 299 |
| 7 | 2 | 51 | 73 | 126 |
| 8 | - | 10 | 25 | 35 |
| 9 | - | 3 | 9 | 12 |
| 10-19 | 2 | 19 | 33 | 54 |
| 20-29 | - | 2 | 13 | 15 |
| 30-39 | - | - | 3 | 3 |
| 40-49 | - | - | - | - |
| 50 or more | - | - | 2 | 2 |
| Total | 921 | 46,923 | 167,731 | 215,575 |
| This table does not include pedestrians. | ||||
4.2 Passenger Vehicles
Note
The tables in this section count crashes involving at least one passenger vehicle. Passenger vehicles are made up of passenger cars, sport utility vehicles, cargo vans (10,000 lbs or less), passenger vans, and utility trucks/pickup trucks.
| Month | Fatal | Injury | Property Damage | Total Crashes | People Killed | People Injured |
|---|---|---|---|---|---|---|
| January | 32 | 1,772 | 8,525 | 10,329 | 34 | 2,379 |
| February | 22 | 1,835 | 9,333 | 11,190 | 23 | 2,400 |
| March | 25 | 1,649 | 6,292 | 7,966 | 25 | 2,231 |
| April | 31 | 1,800 | 6,373 | 8,204 | 33 | 2,478 |
| May | 40 | 2,147 | 7,882 | 10,069 | 44 | 2,957 |
| June | 39 | 2,414 | 8,190 | 10,643 | 44 | 3,404 |
| July | 38 | 2,214 | 7,607 | 9,859 | 40 | 3,124 |
| August | 50 | 2,326 | 7,537 | 9,913 | 57 | 3,276 |
| September | 58 | 2,219 | 7,945 | 10,222 | 62 | 3,026 |
| October | 60 | 2,256 | 9,434 | 11,750 | 70 | 3,079 |
| November | 23 | 2,007 | 9,588 | 11,618 | 24 | 2,746 |
| December | 39 | 2,215 | 10,313 | 12,567 | 44 | 3,051 |
| Total | 457 | 24,854 | 99,019 | 124,330 | 500 | 34,151 |
| Manner of Collision | IH | US | State | Cnty | Local | Total |
|---|---|---|---|---|---|---|
| Front To Front | 85 | 253 | 724 | 408 | 2,258 | 3,728 |
| Front To Rear | 2,900 | 2,561 | 6,123 | 2,867 | 10,514 | 24,965 |
| Front To Side | 838 | 1,734 | 5,518 | 2,748 | 16,928 | 27,766 |
| No Coll W/Veh In Transport | 5,695 | 4,808 | 11,402 | 9,944 | 19,302 | 51,151 |
| Other | 36 | 79 | 189 | 116 | 920 | 1,340 |
| Rear To Rear | 27 | 42 | 132 | 78 | 1,617 | 1,896 |
| Rear To Side | 19 | 71 | 248 | 147 | 2,885 | 3,370 |
| Sideswipe/Opposite Direction | 18 | 82 | 242 | 161 | 952 | 1,455 |
| Sideswipe/Same Direction | 1,216 | 695 | 1,531 | 506 | 3,571 | 7,519 |
| Unknown | 12 | 11 | 55 | 25 | 1,037 | 1,140 |
| Total | 10,846 | 10,336 | 26,164 | 17,000 | 59,984 | 124,330 |
| Cnty = County Highway, IH = Interstate Highway. | ||||||
| Vehicle PCCs for Passenger Vehicles | Fatal | Injury | Property Damage | Total |
|---|---|---|---|---|
| Body, Doors | 2 | 165 | 515 | 682 |
| Brakes | 3 | 294 | 814 | 1,111 |
| Coupling Device/Trailer Hitch/Safety Chains | 1 | 14 | 80 | 95 |
| Disabled Due To Prior Crash | 2 | 13 | 44 | 59 |
| Exhaust System | 1 | 5 | 18 | 24 |
| Head Lamps | 3 | 55 | 137 | 195 |
| Mirrors | 2 | 22 | 51 | 75 |
| Power Train | 2 | 42 | 105 | 149 |
| Steering | 2 | 111 | 293 | 406 |
| Stop Lamps | 2 | 14 | 26 | 42 |
| Suspension | 2 | 35 | 99 | 136 |
| Tail Lamps | 1 | 14 | 35 | 50 |
| Tires | 7 | 217 | 706 | 930 |
| Turn Signals | 2 | 17 | 46 | 65 |
| Wheels | 2 | 64 | 271 | 337 |
| Windows /Wind Shield | 3 | 53 | 117 | 173 |
| Wipers | 2 | 2 | 9 | 13 |
| Other Disabled | 1 | 36 | 108 | 145 |
| Other | 3 | 90 | 379 | 472 |
| Unknown | 86 | 1,991 | 14,702 | 16,779 |
| Not Applicable | 572 | 39,859 | 125,784 | 166,215 |
| Total | 701 | 43,113 | 144,339 | 188,153 |
| The numbers in this table represent the number of times a given vehicle PCC was cited in a crash. The numbers do not represent numbers of crashes or drivers. | ||||
| Driver PCCs for Passenger Vehicles | Pass Veh Drivers | Other Drivers | Total | ||||
|---|---|---|---|---|---|---|---|
| Fatal | Injury | Property Damage | Fatal | Injury | Property Damage | ||
| Disregarded Other Road Markings | 3 | 157 | 361 | - | 6 | 14 | 541 |
| Disregarded Other Traffic Control | 7 | 280 | 520 | - | 8 | 7 | 822 |
| Disregarded Red Light | 11 | 1,309 | 1,601 | 1 | 32 | 19 | 2,973 |
| Disregarded Stop Sign | 32 | 894 | 1,162 | 2 | 26 | 10 | 2,126 |
| Exceed Speed Limit | 90 | 1,456 | 2,013 | 10 | 46 | 17 | 3,632 |
| Failed To Keep In Designated Lane | 77 | 2,011 | 5,244 | 5 | 44 | 184 | 7,565 |
| Failed To Yield Right-Of-Way | 63 | 5,669 | 10,766 | 4 | 164 | 239 | 16,905 |
| Failure To Control | 118 | 5,016 | 13,036 | 5 | 103 | 146 | 18,424 |
| Following Too Close | 5 | 2,377 | 6,917 | 2 | 109 | 142 | 9,552 |
| Improper Overtaking / Passing Left | 8 | 202 | 710 | 1 | 18 | 20 | 959 |
| Improper Overtaking / Passing Right | 1 | 129 | 503 | 1 | 18 | 17 | 669 |
| Improper Turn | 3 | 421 | 2,071 | - | 21 | 157 | 2,673 |
| Looked But Did Not See | 14 | 1,589 | 6,140 | - | 59 | 383 | 8,185 |
| No Contributing Action | 204 | 18,294 | 52,987 | 79 | 1,206 | 2,707 | 75,477 |
| Operated Motor Vehicle In Aggressive/Reckless Manner | 47 | 1,073 | 2,087 | 6 | 17 | 10 | 3,240 |
| Operated Motor Vehicle In Inattentive, Careless, Negligent, or Erratic Manner | 58 | 3,280 | 7,365 | 3 | 56 | 136 | 10,898 |
| Other Contributing Action | 27 | 1,865 | 5,128 | 3 | 70 | 249 | 7,342 |
| Over-Correcting/Over-Steering | 21 | 447 | 843 | - | 4 | 7 | 1,322 |
| Racing | 3 | 35 | 54 | - | - | - | 92 |
| Ran Off Roadway | 62 | 1,812 | 3,616 | - | 7 | 9 | 5,506 |
| Speed Too Fast/Cond | 60 | 2,156 | 6,941 | 3 | 68 | 62 | 9,290 |
| Swerved or Avoided Due To Wind, Slippery Surface, Motor Vehicle, Object, Non-Motorist In Rdwy, Etc. | 8 | 289 | 809 | 3 | 28 | 32 | 1,169 |
| Unknown | 111 | 2,981 | 17,524 | 26 | 111 | 514 | 21,267 |
| Unsafe Backing | 1 | 197 | 4,708 | 2 | 8 | 258 | 5,174 |
| Wrong Side or Wrong Way | 29 | 384 | 604 | 1 | 8 | 10 | 1,036 |
| Total | 1,063 | 54,323 | 153,710 | 157 | 2,237 | 5,349 | 216,839 |
| The numbers in this table represent the number of times a driver was cited as a possible contributing circumstance (PCC) in a crash. The numbers do not represent numbers of crashes or drivers. | |||||||
4.3 Commercial Motor Vehicles
Note
The tables in this section count crashes involving at least one commercial motor vehicle (CMV). CMVs are made up of straight trucks and truck tractors - including trailers not attached and trailers attached.
| Month | Fatal | Injury | Property Damage | Total Crashes | People Killed | People Injured |
|---|---|---|---|---|---|---|
| January | 6 | 75 | 459 | 540 | 6 | 94 |
| February | 2 | 115 | 560 | 677 | 2 | 148 |
| March | 2 | 74 | 327 | 403 | 2 | 92 |
| April | 6 | 95 | 328 | 429 | 6 | 140 |
| May | 8 | 81 | 396 | 485 | 12 | 103 |
| June | 7 | 111 | 475 | 593 | 8 | 146 |
| July | 4 | 81 | 480 | 565 | 4 | 118 |
| August | 9 | 113 | 454 | 576 | 11 | 145 |
| September | 12 | 121 | 469 | 602 | 14 | 158 |
| October | 12 | 98 | 502 | 612 | 15 | 124 |
| November | 1 | 81 | 466 | 548 | 1 | 103 |
| December | 7 | 128 | 607 | 742 | 8 | 173 |
| Total | 76 | 1,173 | 5,523 | 6,772 | 89 | 1,544 |
| Manner of Collision | IH | US | State | Cnty | Local | Total |
|---|---|---|---|---|---|---|
| Front To Front | 23 | 28 | 42 | 8 | 58 | 159 |
| Front To Rear | 347 | 152 | 290 | 132 | 328 | 1,249 |
| Front To Side | 262 | 157 | 280 | 176 | 551 | 1,426 |
| No Coll W/Veh In Transport | 543 | 214 | 368 | 202 | 899 | 2,226 |
| Other | 12 | 5 | 22 | 14 | 67 | 120 |
| Rear To Rear | 1 | 3 | 5 | 4 | 65 | 78 |
| Rear To Side | 5 | 6 | 18 | 6 | 119 | 154 |
| Sideswipe/Opposite Direction | 7 | 12 | 29 | 14 | 95 | 157 |
| Sideswipe/Same Direction | 459 | 137 | 207 | 56 | 324 | 1,183 |
| Unknown | 7 | - | 2 | - | 11 | 20 |
| Total | 1,666 | 714 | 1,263 | 612 | 2,517 | 6,772 |
| Cnty = County Highway, IH = Interstate Highway. | ||||||
| Vehicle PCCs for CMVs | Fatal | Injury | Property Damage | Total |
|---|---|---|---|---|
| Body, Doors | - | - | 6 | 6 |
| Brakes | 1 | 11 | 30 | 42 |
| Coupling Device/Trailer Hitch/Safety Chains | - | 2 | 24 | 26 |
| Disabled Due To Prior Crash | - | - | - | - |
| Exhaust System | - | 1 | - | 1 |
| Head Lamps | - | - | 1 | 1 |
| Mirrors | - | - | 1 | 1 |
| Power Train | - | 1 | 5 | 6 |
| Steering | - | 1 | 11 | 12 |
| Stop Lamps | - | 1 | - | 1 |
| Suspension | - | - | 2 | 2 |
| Tail Lamps | - | - | 1 | 1 |
| Tires | - | 14 | 56 | 70 |
| Turn Signals | - | - | 1 | 1 |
| Wheels | - | 2 | 22 | 24 |
| Windows /Wind Shield | - | - | 2 | 2 |
| Wipers | - | - | 1 | 1 |
| Other Disabled | - | 2 | 6 | 8 |
| Other | - | 15 | 71 | 86 |
| Unknown | 8 | 56 | 507 | 571 |
| Not Applicable | 81 | 1,171 | 5,115 | 6,367 |
| Total | 90 | 1,277 | 5,862 | 7,229 |
| The numbers in this table represent the number of times a given vehicle PCC was cited in a crash. The numbers do not represent numbers of crashes or drivers. | ||||
| Driver PCCs for CMVs | CMV Drivers | Other Drivers | Total | ||||
|---|---|---|---|---|---|---|---|
| Fatal | Injury | Property Damage | Fatal | Injury | Property Damage | ||
| Disregarded Other Road Markings | 1 | 1 | 31 | 1 | 6 | 21 | 61 |
| Disregarded Other Traffic Control | - | 5 | 45 | 1 | 11 | 20 | 82 |
| Disregarded Red Light | - | 13 | 14 | 1 | 22 | 30 | 80 |
| Disregarded Stop Sign | - | 15 | 13 | 6 | 25 | 17 | 76 |
| Exceed Speed Limit | 1 | 9 | 11 | 2 | 34 | 49 | 106 |
| Failed To Keep In Designated Lane | 2 | 58 | 293 | 15 | 69 | 227 | 664 |
| Failed To Yield Right-Of-Way | - | 80 | 177 | 15 | 119 | 366 | 757 |
| Failure To Control | 3 | 134 | 382 | 10 | 129 | 287 | 945 |
| Following Too Close | 1 | 73 | 121 | 3 | 63 | 140 | 401 |
| Improper Overtaking / Passing Left | - | 4 | 19 | 1 | 16 | 73 | 113 |
| Improper Overtaking / Passing Right | - | 3 | 16 | - | 11 | 67 | 97 |
| Improper Turn | - | 13 | 276 | 1 | 19 | 58 | 367 |
| Looked But Did Not See | 3 | 45 | 391 | 1 | 53 | 110 | 603 |
| No Contributing Action | 54 | 661 | 2,482 | 8 | 524 | 1,505 | 5,234 |
| Operated Motor Vehicle In Aggressive/Reckless Manner | - | 4 | 16 | 4 | 21 | 35 | 80 |
| Operated Motor Vehicle In Inattentive, Careless, Negligent, or Erratic Manner | 3 | 63 | 217 | 5 | 97 | 184 | 569 |
| Other Contributing Action | 2 | 48 | 315 | 3 | 64 | 166 | 598 |
| Over-Correcting/Over-Steering | - | 11 | 40 | 1 | 11 | 25 | 88 |
| Racing | - | - | - | - | - | 1 | 1 |
| Ran Off Roadway | - | 56 | 108 | 1 | 11 | 29 | 205 |
| Speed Too Fast/Cond | 3 | 77 | 185 | 8 | 84 | 192 | 549 |
| Swerved or Avoided Due To Wind, Slippery Surface, Motor Vehicle, Object, Non-Motorist In Rdwy, Etc. | 2 | 22 | 41 | - | 18 | 22 | 105 |
| Unknown | 19 | 68 | 651 | 38 | 69 | 288 | 1,133 |
| Unsafe Backing | 2 | 11 | 305 | - | 5 | 51 | 374 |
| Wrong Side or Wrong Way | - | 3 | 11 | 6 | 13 | 11 | 44 |
| Total | 96 | 1,477 | 6,160 | 131 | 1,494 | 3,974 | 13,332 |
| The numbers in this table represent the number of times a driver was cited as a possible contributing circumstance (PCC) in a crash. The numbers do not represent numbers of crashes or drivers. | |||||||
| Age Group | Fatal | Injury | Property Damage | Total | |||||
|---|---|---|---|---|---|---|---|---|---|
| F | M | F | M | U | F | M | U | ||
| 0-4 | - | - | - | - | - | - | - | - | - |
| 5-9 | - | - | - | - | - | - | - | - | - |
| 10-14 | - | - | - | - | - | - | - | - | - |
| 15-19 | - | - | - | 9 | - | 4 | 52 | - | 65 |
| 20-24 | - | 6 | 3 | 60 | - | 12 | 268 | - | 349 |
| 25-29 | - | 3 | 4 | 83 | - | 27 | 445 | - | 562 |
| 30-34 | - | 6 | 7 | 109 | - | 23 | 499 | - | 644 |
| 35-39 | - | 13 | 4 | 116 | - | 20 | 514 | - | 667 |
| 40-44 | - | 9 | 6 | 107 | - | 20 | 510 | - | 652 |
| 45-49 | - | 4 | 5 | 112 | - | 18 | 546 | - | 685 |
| 50-54 | 1 | 13 | 11 | 145 | - | 26 | 604 | - | 800 |
| 55-59 | - | 8 | 5 | 155 | - | 24 | 614 | - | 806 |
| 60-64 | - | 14 | 2 | 140 | - | 15 | 512 | - | 683 |
| 65-69 | - | 8 | - | 62 | - | 6 | 227 | - | 303 |
| 70+ | - | 3 | 2 | 46 | - | 4 | 147 | - | 202 |
| Unknown | - | - | - | 1 | 33 | - | 9 | 452 | 495 |
| Total | 1 | 87 | 49 | 1,145 | 33 | 199 | 4,947 | 452 | 6,913 |
| M = Male F = Female U = Unknown. | |||||||||
4.4 School Buses
Note
The tables in this section count crashes involving at least one school bus.
| Month | Fatal | Injury | Property Damage | Total Crashes | People Killed | People Injured |
|---|---|---|---|---|---|---|
| January | - | 2 | 25 | 27 | - | 3 |
| February | - | 5 | 33 | 38 | - | 7 |
| March | 1 | 10 | 13 | 24 | 1 | 14 |
| April | - | 8 | 22 | 30 | - | 14 |
| May | - | - | 30 | 30 | - | - |
| June | - | 3 | 12 | 15 | - | 3 |
| July | - | - | 6 | 6 | - | - |
| August | - | 2 | 14 | 16 | - | 5 |
| September | - | 14 | 47 | 61 | - | 23 |
| October | - | 9 | 38 | 47 | - | 16 |
| November | - | 5 | 39 | 44 | - | 8 |
| December | - | 12 | 39 | 51 | - | 29 |
| Total | 1 | 70 | 318 | 389 | 1 | 122 |
| Time | Sun | Mon | Tue | Wed | Thu | Fri | Sat | Total |
|---|---|---|---|---|---|---|---|---|
| 12am | - | - | - | - | - | - | - | - |
| 1am | - | - | - | - | - | - | - | - |
| 2am | - | - | - | - | - | - | - | - |
| 3am | - | - | - | - | - | - | - | - |
| 4am | - | - | 1 | - | - | - | - | 1 |
| 5am | - | - | 1 | - | 1 | - | 1 | 3 |
| 6am | - | 3 | 5 | 3 | 7 | 4 | - | 22 |
| 7am | - | 15 | 16 | 19 | 8 | 9 | - | 67 |
| 8am | - | 8 | 12 | 9 | 8 | 7 | - | 44 |
| 9am | - | 3 | 2 | 1 | 4 | 4 | - | 14 |
| 10am | - | - | 2 | 3 | 2 | - | 1 | 8 |
| 11am | - | 4 | - | - | 1 | 2 | 1 | 8 |
| 12pm | 1 | 2 | 5 | 4 | 2 | 3 | 1 | 18 |
| 1pm | - | 1 | 3 | 4 | 3 | 3 | 2 | 16 |
| 2pm | - | 12 | 6 | 7 | 6 | 5 | 2 | 38 |
| 3pm | - | 20 | 17 | 13 | 14 | 14 | 1 | 79 |
| 4pm | - | 14 | 5 | 4 | 11 | 6 | 2 | 42 |
| 5pm | - | 2 | 5 | 2 | 2 | 2 | 1 | 14 |
| 6pm | - | - | - | - | 1 | 2 | - | 3 |
| 7pm | - | - | 2 | - | 2 | - | 1 | 5 |
| 8pm | - | 1 | 1 | - | - | - | - | 2 |
| 9pm | - | 1 | - | - | - | 1 | - | 2 |
| 10pm | - | - | - | - | - | - | - | - |
| 11pm | - | - | - | - | - | - | 1 | 1 |
| Unk. | - | - | - | 2 | - | - | - | 2 |
| Manner of Collision | IH | US | State | Cnty | Local | Total |
|---|---|---|---|---|---|---|
| Front To Front | - | - | 4 | 1 | 5 | 10 |
| Front To Rear | 2 | 1 | 24 | 17 | 49 | 93 |
| Front To Side | 1 | 5 | 19 | 13 | 93 | 131 |
| No Coll W/Veh In Transport | 1 | 1 | 4 | 5 | 41 | 52 |
| Other | - | - | - | 1 | 4 | 5 |
| Rear To Rear | - | 1 | - | - | 9 | 10 |
| Rear To Side | - | 1 | 2 | - | 16 | 19 |
| Sideswipe/Opposite Direction | - | - | 1 | 3 | 10 | 14 |
| Sideswipe/Same Direction | - | 1 | 4 | 2 | 48 | 55 |
| Total | 4 | 10 | 58 | 42 | 275 | 389 |
| Cnty = County Highway, IH = Interstate Highway. | ||||||
| Vehicle PCCs for School Buses | Fatal | Injury | Property Damage | Total |
|---|---|---|---|---|
| Body, Doors | - | - | 3 | 3 |
| Brakes | - | - | - | - |
| Coupling Device/Trailer Hitch/Safety Chains | - | - | - | - |
| Disabled Due To Prior Crash | - | - | - | - |
| Exhaust System | - | - | - | - |
| Head Lamps | - | - | - | - |
| Mirrors | - | - | - | - |
| Power Train | - | - | - | - |
| Steering | - | - | - | - |
| Stop Lamps | - | - | - | - |
| Suspension | - | - | - | - |
| Tail Lamps | - | - | - | - |
| Tires | - | - | - | - |
| Turn Signals | - | - | - | - |
| Wheels | - | - | - | - |
| Windows /Wind Shield | - | - | - | - |
| Wipers | - | - | - | - |
| Other Disabled | - | - | - | - |
| Other | - | - | - | - |
| Unknown | - | - | 12 | 12 |
| Not Applicable | 1 | 70 | 300 | 371 |
| Total | 1 | 70 | 315 | 386 |
| The numbers in this table represent the number of times a given vehicle PCC was cited in a crash. The numbers do not represent numbers of crashes or drivers. | ||||
| Driver PCCs for CMVs | School Bus Drivers | Other Drivers | Total | ||||
|---|---|---|---|---|---|---|---|
| Fatal | Injury | Property Damage | Fatal | Injury | Property Damage | ||
| - | - | - | - | - | - | - | - |
| Disregarded Other Road Markings | - | - | - | - | - | 3 | 3 |
| Disregarded Other Traffic Control | - | - | - | - | 2 | 2 | 4 |
| Disregarded Red Light | - | 1 | - | - | 3 | 4 | 8 |
| Disregarded Stop Sign | - | - | - | - | 3 | 8 | 11 |
| Exceed Speed Limit | - | - | - | - | 4 | 5 | 9 |
| Failed To Keep In Designated Lane | - | - | 8 | - | 1 | 10 | 19 |
| Failed To Yield Right-Of-Way | - | 16 | 20 | - | 4 | 30 | 70 |
| Failure To Control | - | 3 | 8 | - | 8 | 21 | 40 |
| Following Too Close | - | 4 | 6 | - | 3 | 19 | 32 |
| Improper Overtaking / Passing Left | - | - | 1 | - | 1 | 5 | 7 |
| Improper Overtaking / Passing Right | - | - | - | - | 1 | 5 | 6 |
| Improper Turn | - | 1 | 18 | - | 1 | 7 | 27 |
| Looked But Did Not See | - | 4 | 25 | - | 2 | 12 | 43 |
| No Contributing Action | - | 39 | 147 | - | 36 | 102 | 324 |
| Operated Motor Vehicle In Aggressive/Reckless Manner | - | - | - | - | 3 | 5 | 8 |
| Operated Motor Vehicle In Inattentive, Careless, Negligent, or Erratic Manner | - | 2 | 15 | - | 10 | 13 | 40 |
| Other Contributing Action | - | 1 | 18 | - | 4 | 9 | 32 |
| Over-Correcting/Over-Steering | - | - | 2 | - | - | 1 | 3 |
| Racing | - | - | - | - | 1 | - | 1 |
| Ran Off Roadway | - | - | 2 | - | - | 1 | 3 |
| Speed Too Fast/Cond | - | 1 | 4 | - | 4 | 19 | 28 |
| Swerved or Avoided Due To Wind, Slippery Surface, Motor Vehicle, Object, Non-Motorist In Rdwy, Etc. | - | - | 3 | - | - | - | 3 |
| Unknown | 1 | 2 | 27 | - | 5 | 16 | 51 |
| Unsafe Backing | - | - | 19 | - | 1 | 8 | 28 |
| Wrong Side or Wrong Way | - | - | - | - | 1 | 2 | 3 |
| Total | 1 | 74 | 323 | - | 98 | 307 | 803 |
| The numbers in this table represent the number of times a driver was cited as a possible contributing circumstance (PCC) in a crash. The numbers do not represent numbers of crashes or drivers. | |||||||
| Age Group | Killed | Injured | No Injury | Total | ||||||
|---|---|---|---|---|---|---|---|---|---|---|
| M | F | U | M | F | U | M | F | U | ||
| 0-4 | - | - | - | 1 | 1 | - | 13 | 9 | - | 24 |
| 5-9 | - | - | - | 4 | 6 | - | 58 | 58 | 2 | 128 |
| 10-14 | - | - | - | 5 | 3 | - | 88 | 74 | 7 | 177 |
| 15-19 | - | - | - | 2 | 1 | - | 40 | 17 | 1 | 61 |
| 20-24 | - | - | - | - | 1 | - | 1 | 4 | - | 6 |
| 25-29 | - | - | - | - | 1 | - | 2 | 11 | - | 14 |
| 30-34 | - | - | - | - | 2 | - | 8 | 20 | - | 30 |
| 35-39 | - | - | - | - | - | - | 10 | 12 | - | 22 |
| 40-44 | - | - | - | 1 | 1 | - | 8 | 16 | - | 26 |
| 45-49 | - | - | - | - | 1 | - | 15 | 15 | - | 31 |
| 50-54 | - | - | - | 1 | 1 | - | 16 | 24 | - | 42 |
| 55-59 | - | - | - | 1 | 1 | - | 17 | 26 | - | 45 |
| 60-64 | - | - | - | 1 | 3 | - | 27 | 26 | - | 57 |
| 65-69 | - | - | - | - | 3 | - | 31 | 19 | - | 53 |
| 70+ | - | - | - | 2 | 1 | - | 56 | 9 | - | 68 |
| Unknown | - | - | - | 1 | 1 | 2 | 29 | 17 | 41 | 91 |
| Total | - | - | - | 19 | 27 | 2 | 419 | 357 | 51 | 875 |
| M = Male F = Female U = Unknown. | ||||||||||
4.5 Pedestrians
| Vehicle Type | Fatal | Injury | Property Damage | Total |
|---|---|---|---|---|
| Passenger Car | 36 | 826 | 53 | 915 |
| (Sport) Utility Vehicle | 8 | 229 | 11 | 248 |
| Utility Truck/Pickup Truck | 12 | 116 | 8 | 136 |
| Passenger Van | - | 40 | 3 | 43 |
| Truck Tractor (Trailer Attached) | 3 | 8 | 4 | 15 |
| Straight Truck | 2 | 10 | - | 12 |
| Motorcycle | - | 9 | - | 9 |
| Passenger Bus/Transit Bus | 1 | 8 | - | 9 |
| Cargo Van (10,000 Lbs or Less) | - | 8 | - | 8 |
| POLICE ON EMERGENCY | - | 2 | 1 | 3 |
| School Bus | 1 | 1 | - | 2 |
| Snow Plow | - | 2 | - | 2 |
| Autocycle | - | 1 | - | 1 |
| Truck Tractor (Trailer Not Attached) | - | 1 | - | 1 |
| Total | 63 | 1,261 | 80 | 1,404 |
| For multiple vehicle crashes involving pedestrians, the pedestrian is counted with each vehicle on this report. Therefore, pedestrian counts are inflated. | ||||
| Month | Fatal | Injury | Property Damage | Total |
|---|---|---|---|---|
| January | 6 | 74 | 2 | 82 |
| February | 5 | 66 | 4 | 75 |
| March | 5 | 66 | 7 | 78 |
| April | 2 | 83 | 4 | 89 |
| May | 2 | 99 | 3 | 104 |
| June | 3 | 95 | 6 | 104 |
| July | 1 | 103 | 8 | 112 |
| August | 4 | 107 | 6 | 117 |
| September | 5 | 118 | 9 | 132 |
| October | 12 | 118 | 9 | 139 |
| November | 1 | 118 | 9 | 128 |
| December | 3 | 104 | 6 | 113 |
| Total | 49 | 1,151 | 73 | 1,273 |
| Time | Sun | Mon | Tue | Wed | Thu | Fri | Sat | Total |
|---|---|---|---|---|---|---|---|---|
| 12am | 6 | 2 | 3 | 3 | 2 | 2 | 4 | 22 |
| 1am | 11 | 1 | 1 | 3 | 3 | 2 | 4 | 25 |
| 2am | 9 | 2 | 2 | 1 | 2 | 2 | 10 | 28 |
| 3am | 3 | 1 | 1 | 2 | 1 | 4 | 3 | 15 |
| 4am | 1 | 3 | - | 1 | - | - | 1 | 6 |
| 5am | 3 | 4 | 2 | - | 2 | 4 | 2 | 17 |
| 6am | 1 | 4 | 4 | 5 | 6 | 6 | 2 | 28 |
| 7am | - | 4 | 5 | 12 | 5 | 7 | 1 | 34 |
| 8am | 3 | 4 | 4 | 6 | 8 | 5 | - | 30 |
| 9am | 3 | 6 | 7 | 9 | 3 | 4 | 6 | 38 |
| 10am | 3 | 3 | 5 | 10 | 5 | 9 | 8 | 43 |
| 11am | 5 | 6 | 8 | 8 | 11 | 9 | 6 | 53 |
| 12pm | 4 | 9 | 14 | 15 | 18 | 9 | 15 | 84 |
| 1pm | 7 | 12 | 8 | 20 | 12 | 14 | 9 | 82 |
| 2pm | 11 | 9 | 14 | 14 | 9 | 13 | 11 | 81 |
| 3pm | 5 | 21 | 24 | 19 | 8 | 17 | 9 | 103 |
| 4pm | 4 | 12 | 17 | 20 | 13 | 14 | 18 | 98 |
| 5pm | 13 | 18 | 12 | 10 | 23 | 18 | 11 | 105 |
| 6pm | 16 | 10 | 12 | 8 | 9 | 17 | 6 | 78 |
| 7pm | 11 | 16 | 8 | 10 | 14 | 12 | 9 | 80 |
| 8pm | 11 | 8 | 11 | 8 | 14 | 14 | 11 | 77 |
| 9pm | 10 | 2 | 5 | 4 | 10 | 11 | 14 | 56 |
| 10pm | 6 | 3 | 6 | 8 | 3 | 12 | 10 | 48 |
| 11pm | - | 4 | 5 | 4 | 5 | 5 | 11 | 34 |
| Unk. | - | 4 | - | - | 2 | 2 | - | 8 |
| Time | IH | US | State | Cnty | Local | Total |
|---|---|---|---|---|---|---|
| Front To Front | 1 | - | 4 | 1 | 21 | 27 |
| Front To Rear | 1 | 2 | 5 | 1 | 21 | 30 |
| Front To Side | - | 3 | 21 | 3 | 75 | 102 |
| No Coll W/Veh In Transport | 8 | 36 | 124 | 36 | 674 | 878 |
| Other | 2 | 9 | 32 | 8 | 141 | 192 |
| Rear To Rear | - | - | 1 | 1 | 3 | 5 |
| Rear To Side | - | - | 1 | - | 10 | 11 |
| Sideswipe/Opposite Direction | - | 1 | - | - | 3 | 4 |
| Sideswipe/Same Direction | 1 | 1 | 3 | 2 | 10 | 17 |
| Unknown | - | - | 1 | - | 6 | 7 |
| Total | 13 | 52 | 192 | 52 | 964 | 1,273 |
| Cnty = County Highway, IH = Interstate Highway. | ||||||
| Age Group | Killed | Injured | Total | ||||||||
|---|---|---|---|---|---|---|---|---|---|---|---|
| Dark/Lighted | Dark/Unlit | Daylight | Unknown | Dark/Lighted | Dark/Unlit | Dawn | Daylight | Dusk | Unknown | ||
| 0-4 | - | - | - | - | 5 | - | - | 21 | 4 | 1 | 31 |
| 5-9 | - | - | 1 | - | 6 | - | - | 34 | 15 | - | 56 |
| 10-14 | - | - | - | - | 14 | 2 | - | 61 | 22 | 2 | 101 |
| 15-19 | - | - | - | - | 40 | 7 | 2 | 56 | 11 | - | 116 |
| 20-24 | 1 | - | - | - | 56 | 4 | 1 | 71 | 6 | 2 | 141 |
| 25-29 | 2 | 1 | - | - | 47 | 7 | 2 | 43 | 4 | 1 | 107 |
| 30-34 | 2 | 1 | 1 | - | 28 | 5 | - | 41 | 5 | - | 83 |
| 35-39 | 7 | 2 | - | - | 30 | 9 | 1 | 39 | 3 | 2 | 93 |
| 40-44 | 2 | 2 | - | - | 27 | 8 | 1 | 33 | 6 | 1 | 80 |
| 45-49 | 1 | 1 | 1 | - | 15 | 4 | 2 | 32 | 3 | - | 59 |
| 50-54 | 3 | - | - | - | 32 | 4 | 3 | 54 | 3 | - | 99 |
| 55-59 | 2 | 3 | 2 | 1 | 26 | 4 | 3 | 43 | 1 | 3 | 88 |
| 60-64 | 4 | 1 | 1 | - | 21 | 4 | 3 | 43 | 4 | - | 81 |
| 65-69 | - | 2 | - | - | 15 | 3 | - | 37 | 2 | 1 | 60 |
| 70+ | 1 | 3 | 2 | - | 13 | 3 | 6 | 82 | 8 | 1 | 119 |
| Unknown | - | - | - | - | 3 | - | - | 3 | - | - | 6 |
| Total | 25 | 16 | 8 | 1 | 378 | 64 | 24 | 693 | 97 | 14 | 1,320 |
| Action | Killed | Injured | Total |
|---|---|---|---|
| No Improper Action | 5 | 559 | 564 |
| Sudden Movement Into Traffic | 5 | 182 | 187 |
| Unknown | 10 | 133 | 143 |
| Improper Crossing Of Roadway (Jaywalking) | 7 | 93 | 100 |
| Dark Clothing | 12 | 87 | 99 |
| Other | 3 | 94 | 97 |
| Walking Not Facing Traffic | 8 | 89 | 97 |
| In Roadway Improperly (Standing, Lying, Working, Playing) | 9 | 43 | 52 |
| Walking Facing Traffic | - | 48 | 48 |
| Not Visible (Dark Clothing, No Lighting, Etc.) | 5 | 38 | 43 |
| Disregarded Signal | 3 | 32 | 35 |
| Failure To Yield Right-Of-Way | 1 | 33 | 34 |
| Inattentive (Talking, Eating, Etc.) | 1 | 20 | 21 |
| Failure To Obey Traffic Signs, Signals, or Officer | 4 | 15 | 19 |
| Entering/Exiting Parked/Standing Vehicle | - | 17 | 17 |
| Operating In Other Erratic, Reckless Careless or Negligent Manner | - | 11 | 11 |
| Disabled Vehicle Related (Working On, Pushing, Leaving/Approaching) | 2 | 7 | 9 |
| Making Improper Entry To or Exit From Trafficway | 1 | 6 | 7 |
| Wrong-Way Riding or Walking | - | 6 | 6 |
| Failing To Have Lights On When Required (Bicycling) | - | 1 | 1 |
| Failure To Keep In Proper Lane or Running Off Road | - | 1 | 1 |
| Improper Turn/Merge | - | 1 | 1 |
| Passing With Insufficient Distance / Inadequate Visibility / Failing To Yield To Overtaking Vehicle | - | 1 | 1 |
| Total | 76 | 1,517 | 1,593 |
| Location | Killed | Injured | Total |
|---|---|---|---|
| At Intersection-In Marked Crosswalk | 8 | 341 | 349 |
| Not At Intersection-On Roadway, Not In Marked Crosswalk | 22 | 289 | 311 |
| Parking Lane/Zone | - | 144 | 144 |
| Other | 1 | 141 | 142 |
| At Intersection-Not In Crosswalk | 2 | 68 | 70 |
| Non-Trafficway Area | - | 61 | 61 |
| Shoulder/Roadside | 6 | 46 | 52 |
| Sidewalk | 1 | 50 | 51 |
| At Intersection-Unmarked Crosswalk/Unknown If Marked Crosswalk | 1 | 49 | 50 |
| Driveway Acess | 1 | 23 | 24 |
| Not At Intersection-In Marked Crosswalk | - | 16 | 16 |
| At Intersection-Unknown Location | 3 | 11 | 14 |
| Not At Intersection-On Roadway, Crosswalk Availability Unknown | - | 11 | 11 |
| Unknown | 2 | 8 | 10 |
| Median/Crossing Island | 2 | 5 | 7 |
| Bicycle Lane | 1 | 3 | 4 |
| Shared-Use Path | - | 4 | 4 |
| Total | 50 | 1,270 | 1,320 |
| Pedestrian's Condition | Fatal Injury | Suspected Serious Injury | Suspected Minor Injury | Possible Injury | No Apparent Injury | Total |
|---|---|---|---|---|---|---|
| Appeared Normal | 9 | 153 | 452 | 256 | 53 | 923 |
| Asleep or Fatigued | - | - | 1 | - | - | 1 |
| Blind | - | 2 | - | - | - | 2 |
| Confused or Disoriented (Non Lucid) | 1 | 12 | 14 | 3 | 1 | 31 |
| Emotional (Depressed, Angry, Disturbed, Etc) | - | 5 | 20 | 6 | 2 | 33 |
| Ill (Sick), Fainted | - | - | 1 | 1 | - | 2 |
| Not Observed | 23 | 59 | 85 | 47 | 47 | 261 |
| Other | 8 | 11 | 11 | 8 | 2 | 40 |
| Paraplegic or Restricted To Wheelchair | - | 1 | 1 | 4 | - | 6 |
| Physically Impaired | 1 | 13 | 16 | 8 | - | 38 |
| Under The Influence Of Medications/Drugs/Alcohol | 6 | 29 | 24 | 7 | 6 | 72 |
| Using Cane or Crutches | - | 1 | - | - | - | 1 |
| Total | 48 | 286 | 625 | 340 | 111 | 1,410 |
| A person may have one or more conditions. | ||||||
| Age Group | Killed | Injured | No Injury | Total |
|---|---|---|---|---|
| 0-4 | - | - | - | - |
| 5-9 | 1 | 6 | - | 7 |
| 10-14 | - | 30 | 1 | 31 |
| 15-19 | - | 18 | 1 | 19 |
| 20-24 | - | 4 | - | 4 |
| 25-29 | - | - | - | - |
| 30-34 | - | - | - | - |
| 35-39 | - | 2 | - | 2 |
| 40-44 | - | 1 | - | 1 |
| 45-49 | - | 2 | - | 2 |
| 50-54 | - | - | - | - |
| 55-59 | - | - | - | - |
| 60-64 | - | - | - | - |
| 65-69 | - | - | - | - |
| 70+ | - | 1 | - | 1 |
| Unknown | - | - | - | - |
| Total | 1 | 64 | 2 | 67 |
4.6 Bicyclists
| Vehicle Type | Fatal | Injury | Property Damage | Total |
|---|---|---|---|---|
| Bicycle | 9 | 601 | 88 | 698 |
| Passenger Car | 4 | 344 | 55 | 403 |
| (Sport) Utility Vehicle | 1 | 150 | 21 | 172 |
| Utility Truck/Pickup Truck | 1 | 67 | 7 | 75 |
| Passenger Van | 2 | 21 | 3 | 26 |
| Cargo Van (10,000 Lbs or Less) | - | 5 | - | 5 |
| POLICE ON EMERGENCY | - | 1 | 2 | 3 |
| Passenger Bus/Transit Bus | - | 3 | - | 3 |
| Truck Tractor (Trailer Attached) | 1 | 2 | - | 3 |
| Straight Truck | - | 1 | 1 | 2 |
| Moped | - | 1 | - | 1 |
| Motorcycle | - | 1 | - | 1 |
| School Bus | - | 1 | - | 1 |
| Truck Tractor (Trailer Not Attached) | - | 1 | - | 1 |
| Total | 18 | 1,199 | 177 | 1,394 |
| For multiple vehicle crashes involving bicyclists, the bicyclist is counted with each vehicle on this report. Therefore, bicycle counts are inflated. | ||||
| Month | Fatal | Injury | Property Damage | Total |
|---|---|---|---|---|
| January | - | 10 | - | 10 |
| February | - | 5 | 1 | 6 |
| March | 1 | 21 | 5 | 27 |
| April | - | 33 | 5 | 38 |
| May | 1 | 53 | 8 | 62 |
| June | 1 | 87 | 14 | 102 |
| July | 2 | 79 | 10 | 91 |
| August | 1 | 92 | 11 | 104 |
| September | 2 | 105 | 19 | 126 |
| October | 1 | 62 | 9 | 72 |
| November | - | 34 | 4 | 38 |
| December | - | 13 | 2 | 15 |
| Total | 9 | 594 | 88 | 691 |
| Time | Sun | Mon | Tue | Wed | Thu | Fri | Sat | Total |
|---|---|---|---|---|---|---|---|---|
| 12am | - | - | 1 | - | - | 2 | - | 3 |
| 1am | - | 1 | 2 | - | 1 | - | 2 | 6 |
| 2am | - | - | - | - | - | 1 | 1 | 2 |
| 3am | - | - | - | - | - | - | 3 | 3 |
| 4am | - | - | - | - | - | 1 | - | 1 |
| 5am | - | - | 1 | - | 2 | - | - | 3 |
| 6am | - | - | 2 | 4 | 2 | 4 | 2 | 14 |
| 7am | - | 10 | 6 | 9 | 7 | 8 | 1 | 41 |
| 8am | - | 2 | 7 | 6 | 3 | 3 | 4 | 25 |
| 9am | 1 | 2 | 2 | 3 | 4 | 5 | 4 | 21 |
| 10am | 5 | 4 | 1 | 11 | 5 | 8 | 5 | 39 |
| 11am | 5 | 2 | 3 | 3 | 9 | 6 | 7 | 35 |
| 12pm | 9 | 6 | 6 | 6 | 6 | 6 | 7 | 46 |
| 1pm | 3 | 7 | 6 | 5 | 5 | 5 | 5 | 36 |
| 2pm | 6 | 10 | 9 | 10 | 8 | 11 | 9 | 63 |
| 3pm | 2 | 8 | 24 | 11 | 8 | 6 | 9 | 68 |
| 4pm | 6 | 6 | 18 | 15 | 15 | 9 | 8 | 77 |
| 5pm | 3 | 14 | 8 | 15 | 14 | 10 | 10 | 74 |
| 6pm | 7 | 5 | 3 | 9 | 8 | 12 | 5 | 49 |
| 7pm | 3 | 3 | 7 | 3 | 5 | 3 | 3 | 27 |
| 8pm | 3 | 4 | 4 | 2 | 5 | 5 | 2 | 25 |
| 9pm | 1 | 3 | 2 | - | 2 | 3 | 4 | 15 |
| 10pm | - | 4 | 2 | 2 | 1 | 3 | 1 | 13 |
| 11pm | - | 2 | - | - | - | 1 | 1 | 4 |
| Unk. | - | 1 | - | - | - | - | - | 1 |
| Time | IH | US | State | Cnty | Local | Total |
|---|---|---|---|---|---|---|
| Front To Front | - | 1 | 2 | 2 | 16 | 21 |
| Front To Rear | - | 4 | 5 | 13 | 12 | 34 |
| Front To Side | 3 | 17 | 36 | 24 | 212 | 292 |
| No Coll W/Veh In Transport | - | 18 | 35 | 18 | 176 | 247 |
| Other | - | 6 | 7 | 4 | 43 | 60 |
| Rear To Side | - | - | 2 | - | 12 | 14 |
| Sideswipe/Opposite Direction | - | - | - | - | 3 | 3 |
| Sideswipe/Same Direction | - | 3 | - | 2 | 12 | 17 |
| Unknown | - | - | - | - | 3 | 3 |
| Total | 3 | 49 | 87 | 63 | 489 | 691 |
| Cnty = County Highway, IH = Interstate Highway. | ||||||
| Age Group | Killed | Injured | Total | ||||||||
|---|---|---|---|---|---|---|---|---|---|---|---|
| Dark/Lighted | Dark/Unlit | Daylight | Dusk | Dark/Lighted | Dark/Unlit | Dawn | Daylight | Dusk | Unknown | ||
| 0-4 | - | - | - | - | - | - | - | 2 | - | - | 2 |
| 5-9 | - | - | - | - | 1 | - | - | 27 | 2 | - | 30 |
| 10-14 | - | - | - | - | 8 | 1 | 1 | 95 | 2 | - | 107 |
| 15-19 | 1 | - | 1 | - | 4 | - | 3 | 66 | 3 | - | 78 |
| 20-24 | - | - | - | - | 11 | 3 | - | 49 | 1 | 1 | 65 |
| 25-29 | - | - | - | - | 8 | 5 | - | 30 | 3 | - | 46 |
| 30-34 | - | - | - | - | 7 | 1 | 2 | 20 | 1 | - | 31 |
| 35-39 | - | - | - | - | 2 | 1 | 3 | 25 | 1 | - | 32 |
| 40-44 | - | - | - | 1 | 6 | - | 1 | 18 | - | - | 26 |
| 45-49 | - | - | - | - | 1 | - | - | 18 | - | - | 19 |
| 50-54 | - | - | 1 | - | 4 | 2 | - | 30 | - | - | 37 |
| 55-59 | - | - | 1 | - | 1 | 1 | 1 | 31 | 2 | - | 37 |
| 60-64 | - | 1 | - | - | 4 | - | - | 29 | 1 | - | 35 |
| 65-69 | - | - | - | - | 2 | - | - | 18 | 2 | - | 22 |
| 70+ | - | - | 3 | - | 1 | 1 | 2 | 35 | - | - | 42 |
| Total | 1 | 1 | 6 | 1 | 60 | 15 | 13 | 493 | 18 | 1 | 609 |
| Action | Killed | Injured | Total |
|---|---|---|---|
| No Improper Action | 2 | 251 | 253 |
| Sudden Movement Into Traffic | 1 | 111 | 112 |
| Unknown | 3 | 68 | 71 |
| Failure To Yield Right-Of-Way | 2 | 49 | 51 |
| Failure To Obey Traffic Signs, Signals, or Officer | 1 | 44 | 45 |
| Disregarded Signal | - | 38 | 38 |
| Wrong-Way Riding or Walking | 1 | 32 | 33 |
| Other | 1 | 30 | 31 |
| Dark Clothing | - | 19 | 19 |
| Not Visible (Dark Clothing, No Lighting, Etc.) | - | 19 | 19 |
| Making Improper Entry To or Exit From Trafficway | - | 13 | 13 |
| Improper Crossing Of Roadway (Jaywalking) | - | 12 | 12 |
| Inattentive (Talking, Eating, Etc.) | - | 9 | 9 |
| Improper Turn/Merge | - | 7 | 7 |
| Operation Without Required Equipment (Bicycle Reflectors) | - | 7 | 7 |
| Failure To Keep In Proper Lane or Running Off Road | - | 6 | 6 |
| In Roadway Improperly (Standing, Lying, Working, Playing) | - | 5 | 5 |
| Failing To Have Lights On When Required (Bicycling) | - | 4 | 4 |
| Improper or Erratic Lane Changing | - | 3 | 3 |
| Operating In Other Erratic, Reckless Careless or Negligent Manner | - | 3 | 3 |
| Improper Passing | - | 2 | 2 |
| Total | 11 | 732 | 743 |
| Location | Killed | Injured | Total |
|---|---|---|---|
| At Intersection-In Marked Crosswalk | 1 | 195 | 196 |
| At Intersection-Not In Crosswalk | 1 | 120 | 121 |
| Not At Intersection-On Roadway, Not In Marked Crosswalk | 4 | 82 | 86 |
| At Intersection-Unmarked Crosswalk/Unknown If Marked Crosswalk | - | 46 | 46 |
| Sidewalk | - | 37 | 37 |
| Shoulder/Roadside | 1 | 30 | 31 |
| Bicycle Lane | - | 30 | 30 |
| Driveway Acess | - | 14 | 14 |
| Not At Intersection-In Marked Crosswalk | - | 12 | 12 |
| Other | 1 | 10 | 11 |
| At Intersection-Unknown Location | 1 | 7 | 8 |
| Parking Lane/Zone | - | 5 | 5 |
| Shared-Use Path | - | 5 | 5 |
| Non-Trafficway Area | - | 4 | 4 |
| Not At Intersection-On Roadway, Crosswalk Availability Unknown | - | 2 | 2 |
| Unknown | - | 1 | 1 |
| Total | 9 | 600 | 609 |
| Bicyclist's Condition | Fatal Injury | Suspected Serious Injury | Suspected Minor Injury | Possible Injury | No Apparent Injury | Total |
|---|---|---|---|---|---|---|
| Appeared Normal | 3 | 66 | 349 | 125 | 66 | 609 |
| Confused or Disoriented (Non Lucid) | - | 1 | 6 | 3 | - | 10 |
| Emotional (Depressed, Angry, Disturbed, Etc) | - | - | 7 | 1 | 1 | 9 |
| Not Observed | 7 | 11 | 18 | 4 | 25 | 65 |
| Other | - | 4 | - | 1 | - | 5 |
| Physically Impaired | - | 5 | 1 | - | - | 6 |
| Under The Influence Of Medications/Drugs/Alcohol | - | 1 | 2 | 3 | 1 | 7 |
| Total | 10 | 88 | 383 | 137 | 93 | 711 |
| A person may have one or more conditions. | ||||||
| Age Group | Killed | Injured | No Injury | Total |
|---|---|---|---|---|
| 0-4 | - | - | - | - |
| 5-9 | - | 3 | - | 3 |
| 10-14 | - | 26 | 5 | 31 |
| 15-19 | - | 20 | 3 | 23 |
| 20-24 | - | 1 | - | 1 |
| 25-29 | - | - | - | - |
| 30-34 | - | - | - | - |
| 35-39 | - | - | - | - |
| 40-44 | - | - | - | - |
| 45-49 | - | - | - | - |
| 50-54 | - | - | - | - |
| 55-59 | - | - | - | - |
| 60-64 | - | - | - | - |
| 65-69 | - | - | - | - |
| 70+ | - | - | - | - |
| Unknown | - | - | 1 | 1 |
| Total | - | 50 | 9 | 59 |
4.7 Motorcyclists
Note
The tables in this section count crashes involving at least one motorcycle (MC). Mopeds are not counted as a motorcycle. Motorcyclists includes both drivers and passengers. A motorcycle crash may involve a parked motorcycle without a motorcycle rider.
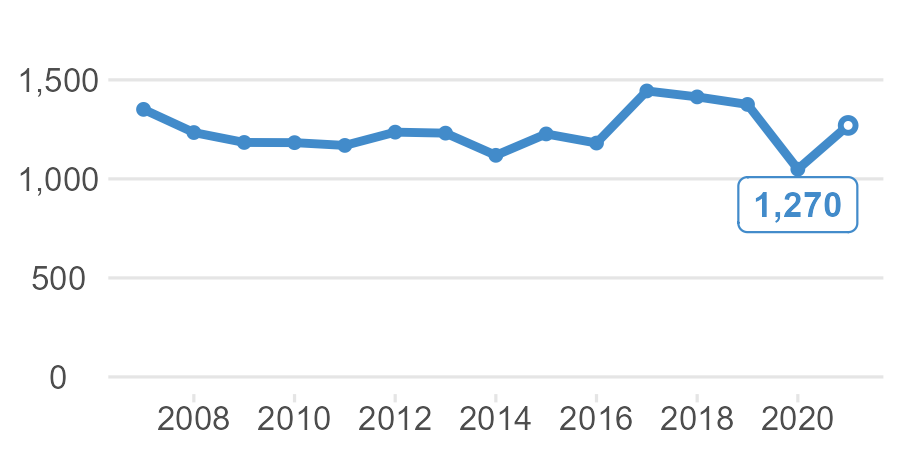
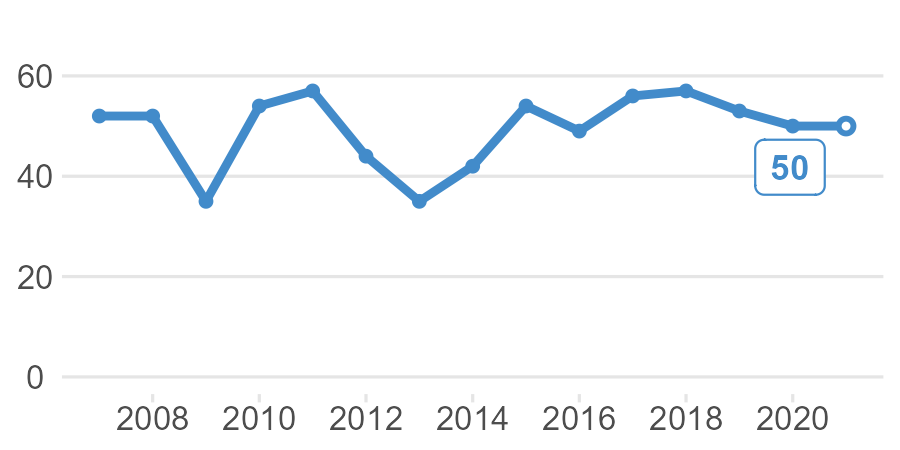
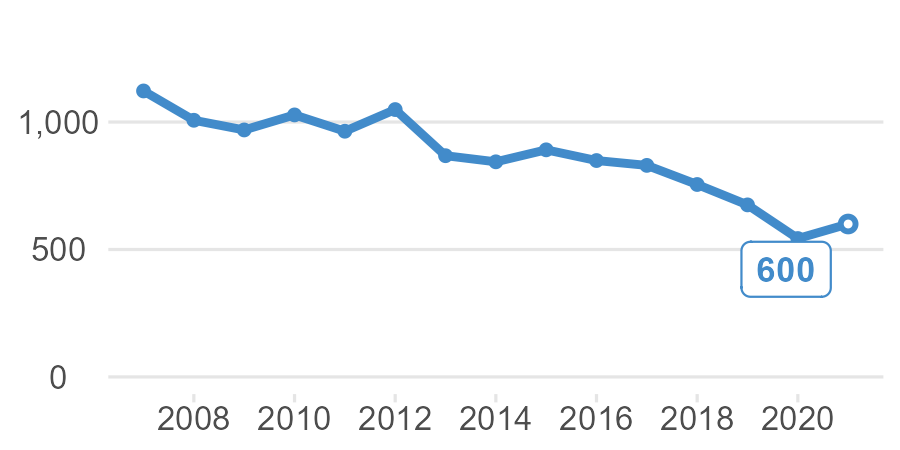
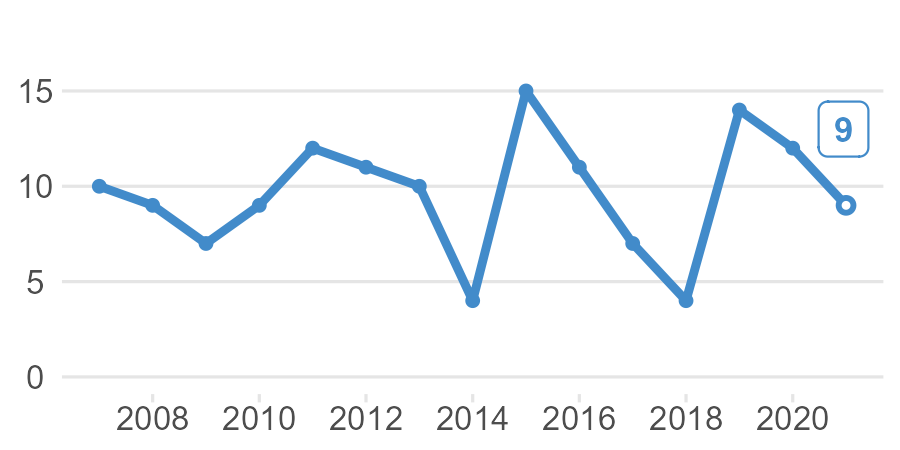
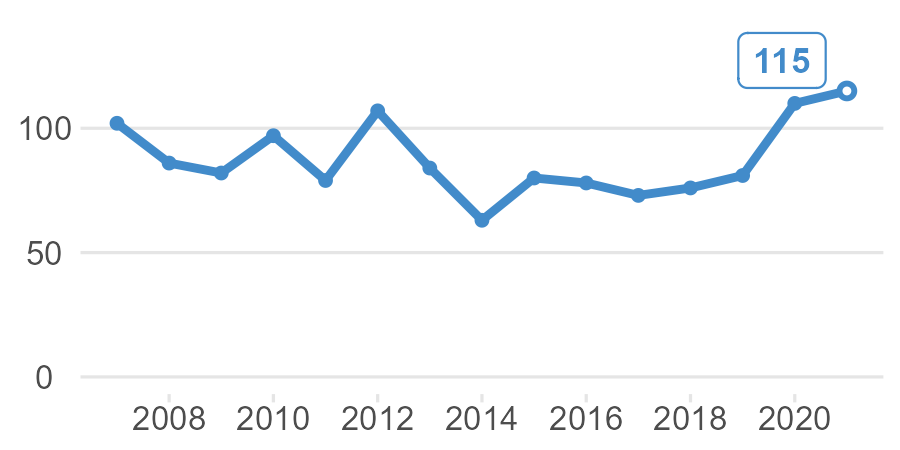
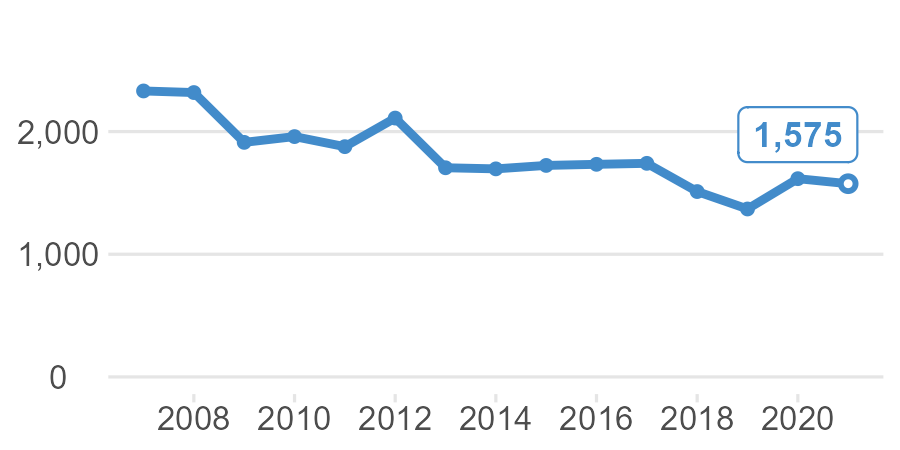
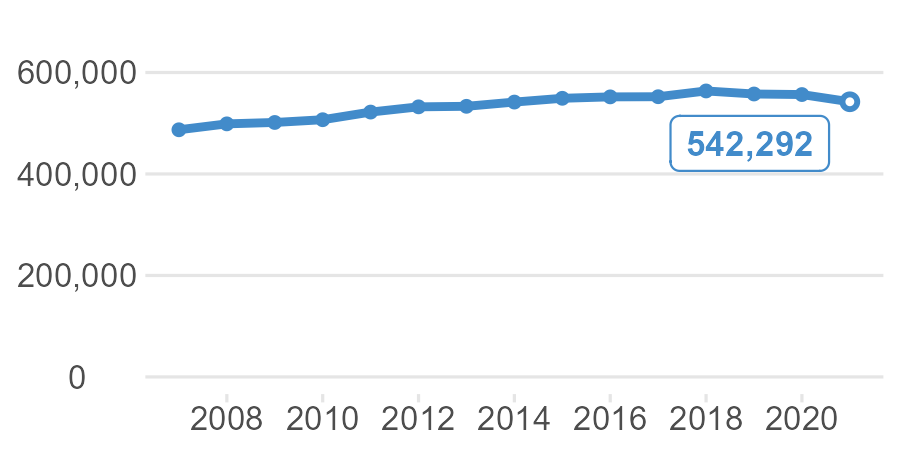
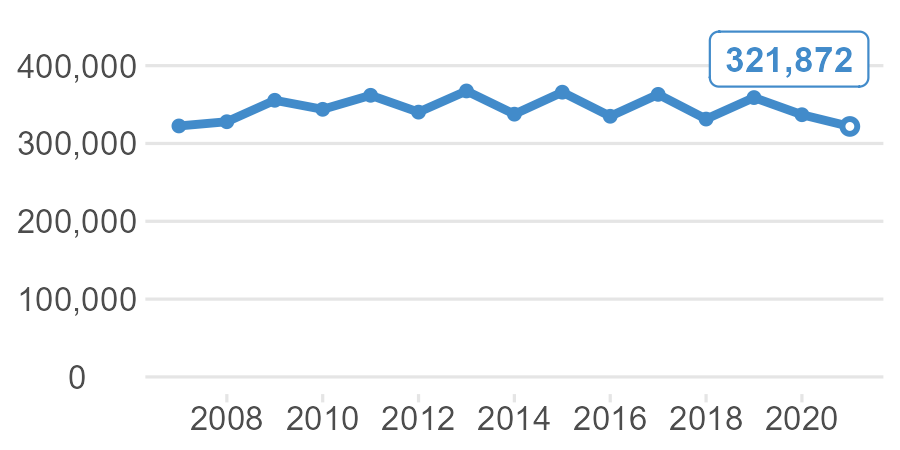
| Year | Registered Motorcycles | Licensed Motorcyclists | MC Fatalities | Single Unit MC Fatalities | Fatal MC Crashes | Injury MC Crashes | Prop. Damage MC Crashes | MC Fatality w/o a Helmet | MC Fatality w/ a Helmet |
|---|---|---|---|---|---|---|---|---|---|
| 2007 | 322,505 | 487,101 | 106 | 51 | 102 | 2,331 | 355 | 70 | 26 |
| 2008 | 327,938 | 498,752 | 87 | 48 | 86 | 2,318 | 425 | 66 | 19 |
| 2009 | 355,487 | 501,514 | 82 | 37 | 82 | 1,912 | 351 | 51 | 27 |
| 2010 | 343,878 | 506,918 | 98 | 46 | 97 | 1,959 | 370 | 72 | 23 |
| 2011 | 361,893 | 521,995 | 80 | 37 | 79 | 1,877 | 375 | 69 | 5 |
| 2012 | 340,268 | 532,309 | 112 | 52 | 107 | 2,110 | 413 | 82 | 25 |
| 2013 | 367,474 | 533,347 | 83 | 41 | 84 | 1,705 | 361 | 60 | 20 |
| 2014 | 337,637 | 541,704 | 67 | 39 | 63 | 1,696 | 342 | 43 | 21 |
| 2015 | 365,878 | 549,154 | 80 | 39 | 80 | 1,724 | 417 | 62 | 14 |
| 2016 | 334,950 | 551,950 | 82 | 44 | 78 | 1,733 | 439 | 63 | 16 |
| 2017 | 363,094 | 552,245 | 76 | 33 | 73 | 1,741 | 392 | 45 | 27 |
| 2018 | 331,356 | 563,608 | 81 | 41 | 76 | 1,511 | 380 | 52 | 28 |
| 2019 | 358,964 | 557,617 | 82 | 40 | 81 | 1,369 | 356 | 53 | 28 |
| 2020 | 336,935 | 556,522 | 113 | 68 | 110 | 1,616 | 378 | 81 | 32 |
| 2021 | 321,872 | 542,292 | 120 | 72 | 115 | 1,575 | 392 | 83 | 35 |
| Vehicle Type | Fatal | Injury | Property Damage | Total Crashes |
|---|---|---|---|---|
| Motorcycle | 120 | 1,618 | 331 | 2,069 |
| Passenger Car | 22 | 339 | 119 | 480 |
| (Sport) Utility Vehicle | 14 | 167 | 49 | 230 |
| Utility Truck/Pickup Truck | 8 | 84 | 25 | 117 |
| Passenger Van | 1 | 30 | 6 | 37 |
| Truck Tractor (Trailer Attached) | 3 | 12 | 2 | 17 |
| Cargo Van (10,000 Lbs or Less) | 1 | 5 | 1 | 7 |
| Straight Truck | 2 | 5 | - | 7 |
| Autocycle | - | 3 | 2 | 5 |
| Farm Tractor/Self Propelled | - | 2 | 1 | 3 |
| Other Working Machine | - | 3 | - | 3 |
| POLICE ON EMERGENCY | - | 3 | - | 3 |
| ATV/UTV (Utility Terrain Vehicle) | - | 1 | - | 1 |
| Bicycle | - | 1 | - | 1 |
| Fire Truck On Emergency | - | 1 | - | 1 |
| Motor Home | 1 | - | - | 1 |
| School Bus | - | 1 | - | 1 |
| Total | 172 | 2,275 | 536 | 2,983 |
| For multiple vehicle crashes involving motorcyclists, the motorcyclist is counted with each vehicle on this report. Therefore, motorcyclist counts are inflated. | ||||
| Month | Fatal | Injury | Property Damage | Total |
|---|---|---|---|---|
| January | - | 1 | 1 | 2 |
| February | 1 | 4 | - | 5 |
| March | - | 65 | 16 | 81 |
| April | 8 | 99 | 33 | 140 |
| May | 16 | 216 | 48 | 280 |
| June | 18 | 283 | 79 | 380 |
| July | 19 | 282 | 54 | 355 |
| August | 20 | 229 | 52 | 301 |
| September | 17 | 232 | 65 | 314 |
| October | 15 | 138 | 31 | 184 |
| November | - | 21 | 11 | 32 |
| December | 1 | 5 | 2 | 8 |
| Total | 115 | 1,575 | 392 | 2,082 |
| Time | Sun | Mon | Tue | Wed | Thu | Fri | Sat | Total |
|---|---|---|---|---|---|---|---|---|
| 12am | 10 | 6 | 1 | 5 | 4 | 5 | 9 | 40 |
| 1am | 9 | 7 | 1 | 1 | 4 | 7 | 3 | 32 |
| 2am | 8 | 3 | - | 1 | 2 | - | 10 | 24 |
| 3am | 3 | 1 | 4 | 2 | - | 2 | 2 | 14 |
| 4am | 1 | - | 2 | 1 | - | 5 | 3 | 12 |
| 5am | 1 | 1 | 2 | 6 | 2 | 5 | 3 | 20 |
| 6am | 2 | 8 | 8 | 3 | 7 | 5 | 2 | 35 |
| 7am | 1 | 4 | 3 | 12 | 10 | 7 | 5 | 42 |
| 8am | 1 | 5 | 4 | 5 | 6 | 5 | 7 | 33 |
| 9am | 10 | 4 | 8 | 2 | 6 | 2 | 5 | 37 |
| 10am | 21 | 9 | 2 | 5 | 5 | 9 | 16 | 67 |
| 11am | 20 | 14 | 5 | 9 | 11 | 13 | 33 | 105 |
| 12pm | 35 | 8 | 7 | 15 | 10 | 11 | 40 | 126 |
| 1pm | 31 | 16 | 10 | 12 | 17 | 24 | 29 | 139 |
| 2pm | 29 | 22 | 15 | 15 | 18 | 25 | 37 | 161 |
| 3pm | 45 | 15 | 17 | 23 | 17 | 22 | 44 | 183 |
| 4pm | 41 | 21 | 22 | 18 | 17 | 23 | 36 | 178 |
| 5pm | 38 | 37 | 19 | 21 | 12 | 23 | 47 | 197 |
| 6pm | 29 | 13 | 25 | 20 | 16 | 29 | 48 | 180 |
| 7pm | 30 | 14 | 18 | 15 | 14 | 16 | 34 | 141 |
| 8pm | 30 | 6 | 9 | 16 | 16 | 22 | 11 | 110 |
| 9pm | 16 | 5 | 6 | 13 | 12 | 17 | 17 | 86 |
| 10pm | 8 | 4 | 1 | 5 | 4 | 12 | 15 | 49 |
| 11pm | 5 | 7 | 5 | 4 | 2 | 16 | 11 | 50 |
| Unk. | 7 | 3 | 1 | 2 | 3 | 3 | 2 | 21 |
| Time | IH | US | State | Cnty | Local | Total |
|---|---|---|---|---|---|---|
| Front To Front | - | 3 | 13 | 6 | 25 | 47 |
| Front To Rear | 17 | 33 | 79 | 39 | 82 | 250 |
| Front To Side | 4 | 23 | 85 | 47 | 240 | 399 |
| No Coll W/Veh In Transport | 58 | 79 | 304 | 344 | 462 | 1,247 |
| Other | - | 2 | 8 | 3 | 14 | 27 |
| Rear To Rear | 1 | - | - | - | 8 | 9 |
| Rear To Side | - | - | 6 | 2 | 6 | 14 |
| Sideswipe/Opposite Direction | - | 3 | 6 | 6 | 10 | 25 |
| Sideswipe/Same Direction | 7 | 6 | 16 | 6 | 20 | 55 |
| Unknown | 2 | - | - | - | 7 | 9 |
| Total | 89 | 149 | 517 | 453 | 874 | 2,082 |
| Cnty = County Highway, IH = Interstate Highway. | ||||||
| Age Group | Fatal Injury | Suspected Serious Injury | Suspected Minor Injury | Possible Injury | No Apparent Injury | Total | ||||||||||
|---|---|---|---|---|---|---|---|---|---|---|---|---|---|---|---|---|
| M | F | U | M | F | U | M | F | U | M | F | U | M | F | U | ||
| 0-4 | - | - | - | - | - | - | - | - | - | - | - | - | - | - | - | - |
| 5-9 | - | - | - | 1 | - | - | 2 | - | - | - | - | - | 2 | - | - | 5 |
| 10-14 | 1 | - | - | - | 1 | - | 2 | - | - | - | 1 | - | 2 | 2 | - | 9 |
| 15-19 | 3 | 1 | - | 21 | 3 | - | 42 | 4 | - | 8 | - | - | 20 | 1 | - | 103 |
| 20-24 | 7 | - | - | 57 | 5 | - | 75 | 15 | - | 22 | 4 | - | 42 | 5 | - | 232 |
| 25-29 | 9 | - | - | 64 | 11 | - | 87 | 18 | - | 19 | 2 | - | 43 | 6 | - | 259 |
| 30-34 | 10 | - | - | 61 | 9 | - | 73 | 14 | - | 14 | 4 | - | 26 | 7 | - | 218 |
| 35-39 | 12 | - | - | 45 | 13 | - | 73 | 12 | - | 18 | 2 | - | 31 | 2 | - | 208 |
| 40-44 | 6 | 2 | - | 37 | 7 | - | 60 | 16 | - | 15 | 3 | - | 32 | 9 | - | 187 |
| 45-49 | 9 | 2 | - | 54 | 15 | - | 60 | 22 | - | 22 | 7 | - | 32 | 6 | 1 | 230 |
| 50-54 | 14 | 2 | - | 49 | 8 | - | 43 | 20 | - | 19 | 4 | - | 34 | 7 | - | 200 |
| 55-59 | 14 | 1 | - | 56 | 9 | - | 81 | 23 | - | 21 | 3 | - | 34 | 5 | - | 247 |
| 60-64 | 10 | 3 | - | 50 | 4 | - | 47 | 15 | - | 10 | 1 | - | 24 | 6 | - | 170 |
| 65-69 | 3 | 1 | - | 27 | 3 | - | 45 | 3 | - | 5 | 2 | - | 16 | 6 | - | 111 |
| 70+ | 10 | - | - | 17 | 2 | - | 39 | 4 | - | 3 | 1 | - | 14 | 1 | - | 91 |
| Unknown | - | - | - | - | - | - | - | - | - | 1 | - | 3 | 1 | - | 34 | 39 |
| Total | 108 | 12 | - | 539 | 90 | - | 729 | 166 | - | 177 | 34 | 3 | 353 | 63 | 35 | 2,309 |
| M = Male F = Female U = Unknown. | ||||||||||||||||
| Driver PCCs for Passenger Cars | Motorcycle Drivers | Other Drivers | Total | ||||
|---|---|---|---|---|---|---|---|
| Fatal | Injury | Property Damage | Fatal | Injury | Property Damage | ||
| Disregarded Other Road Markings | 1 | 6 | 5 | - | 5 | 1 | 18 |
| Disregarded Other Traffic Control | - | 9 | - | - | 3 | 1 | 13 |
| Disregarded Red Light | - | 11 | 3 | 1 | 7 | 4 | 26 |
| Disregarded Stop Sign | 3 | 17 | 1 | - | 10 | 1 | 32 |
| Exceed Speed Limit | 29 | 123 | 16 | 2 | 8 | 1 | 179 |
| Failed To Keep In Designated Lane | 19 | 78 | 10 | - | 16 | 9 | 132 |
| Failed To Yield Right-Of-Way | 3 | 46 | 12 | 14 | 217 | 30 | 322 |
| Failure To Control | 32 | 416 | 46 | - | 17 | 6 | 517 |
| Following Too Close | 3 | 61 | 19 | 1 | 16 | 10 | 110 |
| Improper Overtaking / Passing Left | 7 | 23 | 5 | - | 5 | 4 | 44 |
| Improper Overtaking / Passing Right | 1 | 17 | 6 | - | 3 | 2 | 29 |
| Improper Turn | 1 | 9 | 8 | - | 20 | 8 | 46 |
| Looked But Did Not See | - | 15 | 5 | 3 | 81 | 13 | 117 |
| Operated Motor Vehicle In Aggressive/Reckless Manner | 13 | 67 | 11 | 1 | 8 | 2 | 102 |
| Operated Motor Vehicle In Inattentive, Careless, Negligent, or Erratic Manner | 8 | 64 | 10 | 3 | 45 | 9 | 139 |
| Other Contributing Action | 7 | 59 | 10 | - | 16 | 7 | 99 |
| Over-Correcting/Over-Steering | 2 | 20 | 1 | - | 1 | - | 24 |
| Racing | 2 | 3 | 1 | - | 1 | - | 7 |
| Ran Off Roadway | 19 | 133 | 13 | - | 1 | - | 166 |
| Speed Too Fast/Cond | 10 | 114 | 14 | - | 5 | - | 143 |
| Swerved or Avoided Due To Wind, Slippery Surface, Motor Vehicle, Object, Non-Motorist In Rdwy, Etc. | 2 | 25 | 3 | 1 | 1 | - | 32 |
| Unsafe Backing | - | 1 | 1 | - | 7 | 8 | 17 |
| Wrong Side or Wrong Way | 2 | 5 | - | - | 5 | 2 | 14 |
| Total | 164 | 1,322 | 200 | 26 | 498 | 118 | 2,328 |
| The numbers in this table represent the number of times a driver was cited as a possible contributing circumstance (PCC) in a crash. The numbers do not represent numbers of crashes or drivers. | |||||||
| Motorcycle Driver's Condition | Fatal Injury | Suspected Serious Injury | Suspected Minor Injury | Possible Injury | No Apparent Injury | Total |
|---|---|---|---|---|---|---|
| Appeared Normal | 21 | 388 | 687 | 164 | 287 | 1,547 |
| Asleep or Fatigued | - | 2 | 1 | 1 | - | 4 |
| Confused or Disoriented (Non Lucid) | 2 | 37 | 10 | 4 | - | 53 |
| Emotional (Depressed, Angry, Disturbed, Etc) | - | 5 | 8 | 1 | 1 | 15 |
| Ill (Sick), Fainted | 1 | - | 3 | 1 | - | 5 |
| Not Observed | 61 | 72 | 42 | 11 | 63 | 249 |
| Other | 21 | 18 | 5 | 1 | - | 45 |
| Physically Impaired | 1 | 23 | 14 | 5 | 2 | 45 |
| Under The Influence Of Medications/Drugs/Alcohol | 6 | 56 | 37 | 6 | 13 | 118 |
| Total | 113 | 601 | 807 | 194 | 366 | 2,081 |
| A person may have one or more conditions. | ||||||
4.8 Vehicles Pulling a Trailer
| Vehicle type | Fatal | Injury | Property Damage | Total |
|---|---|---|---|---|
| Passenger Vehicle | 18 | 358 | 17,327 | 17,703 |
| CMV | 55 | 737 | 3,490 | 4,282 |
| Motorcycle/Moped | - | 2 | 40 | 42 |
| School Bus | - | - | 5 | 5 |
| Bicycle | - | - | - | - |
| Other | 7 | 57 | 217 | 281 |
| Total | 80 | 1,154 | 21,079 | 22,313 |
| Year | Fatal Injury | Suspected Serious Injury | Suspected Minor Injury | Possible Injury | No Apparent Injury | Total |
|---|---|---|---|---|---|---|
| 2021 | 81 | 176 | 682 | 617 | 27,651 | 29,207 |