| Injury | Worn | Not Worn | Total | ||||||||||||||||||
|---|---|---|---|---|---|---|---|---|---|---|---|---|---|---|---|---|---|---|---|---|---|
| 1 | 2 | 3 | 4 | 5 | 6 | 7 | 8 | 9 | Other | 1 | 2 | 3 | 4 | 5 | 6 | 7 | 8 | 9 | Other | ||
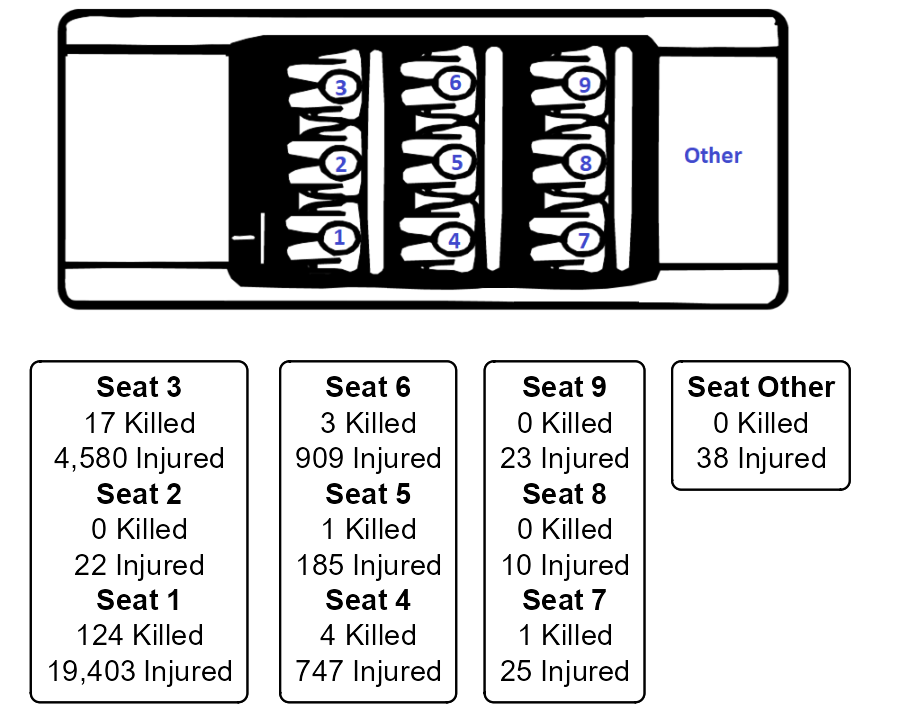
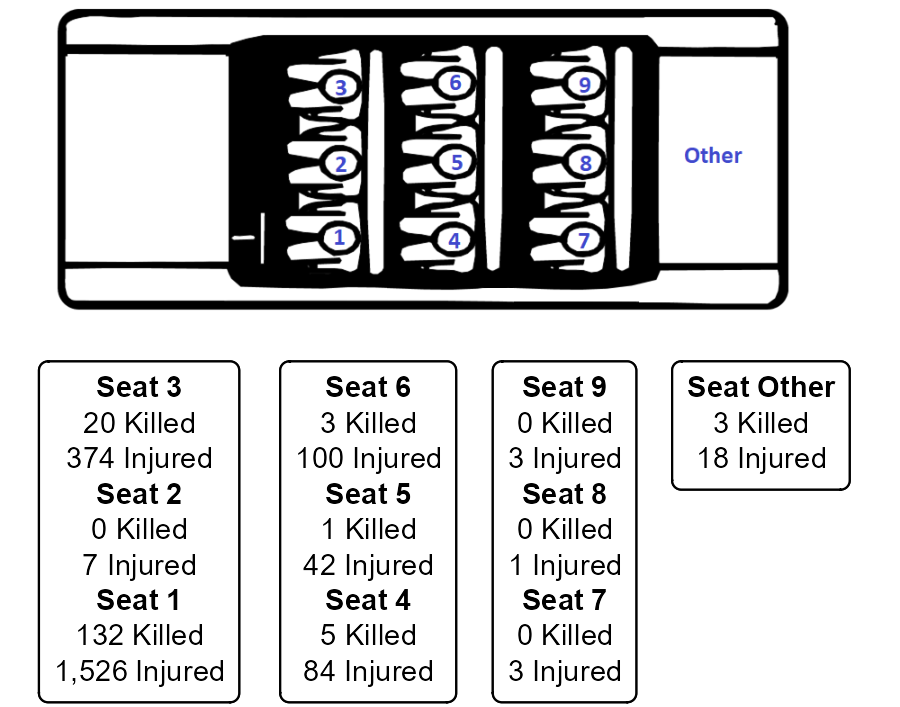
| Killed | 124 | - | 17 | 4 | 1 | 3 | 1 | - | - | - | 132 | - | 20 | 5 | 1 | 3 | - | - | - | 3 | 314 |
| Injured | 19,403 | 22 | 4,580 | 747 | 185 | 909 | 25 | 10 | 23 | 38 | 1,526 | 7 | 374 | 84 | 42 | 100 | 3 | 1 | 3 | 18 | 28,100 |
| No Injury | 116,444 | 99 | 24,572 | 6,302 | 1,516 | 7,741 | 223 | 83 | 261 | 177 | 4,298 | 8 | 589 | 142 | 65 | 163 | 8 | 5 | 7 | 45 | 162,748 |
| Total | 135,971 | 121 | 29,169 | 7,053 | 1,702 | 8,653 | 249 | 93 | 284 | 215 | 5,956 | 15 | 983 | 231 | 108 | 266 | 11 | 6 | 10 | 66 | 191,162 |
| Unknown seat positions were removed. These tables count occupants for whom seat belt use was recorded on the crash report form and whose role was not unknown. Caution: Safety equipment use for many occupants was self-reported. Therefore, these figures may overstate actual use of safety equipment. | |||||||||||||||||||||
8 Safety Equipment
8.1 Passenger Cars: Seat Belt Use
Note
Passenger vehicles are made up of passenger cars, sport utility vehicles, cargo vans (10,000 lbs or less), passenger vans, and utility trucks/pickup trucks.
| Seat belt | Killed | Injured | No Injury | Total | ||||||
|---|---|---|---|---|---|---|---|---|---|---|
| Driver | Passenger | Other | Driver | Passenger | Other | Driver | Passenger | Other | ||
| Shoulder & Lap Belt | 124 | 24 | - | 19,356 | 6,171 | 20 | 131,435 | 35,778 | 217 | 193,125 |
| Lap Belt Only | - | - | - | 35 | 44 | - | 63 | 187 | - | 329 |
| Shoulder Belt Only | - | - | - | 22 | 8 | - | 146 | 45 | 1 | 222 |
| Child Safety Seat | - | 4 | - | 1 | 534 | - | 17 | 6,673 | 14 | 7,243 |
| None | 133 | 33 | 1 | 1,445 | 652 | 111 | 4,252 | 940 | 1,244 | 8,811 |
| Total | 257 | 61 | 1 | 20,859 | 7,409 | 131 | 135,913 | 43,623 | 1,476 | 209,730 |
| A role of Other is either an occupant of motor vehicle not in transport or a pedestrian (non-occupant). These tables count occupants for whom seat belt use was recorded on the crash report form and whose role was not unknown. Caution: Safety equipment use for many occupants was self-reported. Therefore, these figures may overstate actual use of safety equipment. | ||||||||||
| Age Group | Fatal Injury | Suspected Serious Injury | Suspected Minor Injury | Possible Injury | No Apparent Injury | Total | |||||
|---|---|---|---|---|---|---|---|---|---|---|---|
| Worn | Not Worn | Worn | Not Worn | Worn | Not Worn | Worn | Not Worn | Worn | Not Worn | ||
| 0-4 | 2 | 1 | 11 | 4 | 116 | 5 | 236 | 9 | 5,092 | 108 | 5,584 |
| 5-14 | 4 | 2 | 40 | 18 | 432 | 41 | 779 | 40 | 9,285 | 232 | 10,873 |
| 15-24 | 32 | 31 | 278 | 155 | 2,804 | 382 | 3,122 | 205 | 44,868 | 906 | 52,783 |
| 25-34 | 12 | 42 | 282 | 133 | 2,122 | 259 | 2,460 | 159 | 31,345 | 802 | 37,616 |
| 35-44 | 19 | 26 | 189 | 87 | 1,543 | 139 | 2,023 | 87 | 24,456 | 570 | 29,139 |
| 45-54 | 21 | 17 | 177 | 51 | 1,246 | 74 | 1,704 | 69 | 19,492 | 372 | 23,223 |
| 55-64 | 11 | 21 | 161 | 29 | 1,206 | 77 | 1,746 | 49 | 19,187 | 331 | 22,818 |
| 65-74 | 20 | 17 | 115 | 23 | 877 | 32 | 1,142 | 28 | 12,573 | 173 | 15,000 |
| 75-84 | 15 | 4 | 77 | 9 | 460 | 12 | 485 | 8 | 6,010 | 95 | 7,175 |
| 85+ | 16 | 6 | 28 | 2 | 149 | 8 | 140 | 5 | 1,668 | 24 | 2,046 |
| Unknown | - | - | 1 | 3 | 16 | 2 | 24 | 4 | 600 | 2,823 | 3,473 |
| Total | 152 | 167 | 1,359 | 514 | 10,971 | 1,031 | 13,861 | 663 | 174,576 | 6,436 | 209,730 |
| These tables count occupants for whom seat belt use was recorded on the crash report form and whose role was not unknown. Caution: Safety equipment use for many occupants was self-reported. Therefore, these figures may overstate actual use of safety equipment. | |||||||||||
| County | Killed | Injured | No Injury | Total | |||
|---|---|---|---|---|---|---|---|
| Worn | Not Worn | Worn | Not Worn | Worn | Not Worn | ||
| Adams | - | - | 60 | 11 | 392 | 25 | 488 |
| Ashland | 1 | - | 42 | 7 | 375 | 12 | 437 |
| Barron | 3 | 4 | 180 | 16 | 839 | 31 | 1,073 |
| Bayfield | - | - | 37 | 8 | 290 | 5 | 340 |
| Brown | 2 | 2 | 859 | 78 | 5,654 | 183 | 6,778 |
| Buffalo | - | 1 | 37 | 5 | 215 | 4 | 262 |
| Burnett | 1 | 2 | 39 | 9 | 265 | 13 | 329 |
| Calumet | 2 | - | 125 | 9 | 974 | 33 | 1,143 |
| Chippewa | 2 | 2 | 208 | 22 | 1,597 | 53 | 1,884 |
| Clark | 3 | 1 | 110 | 11 | 679 | 27 | 831 |
| Columbia | 2 | 6 | 268 | 31 | 2,018 | 45 | 2,370 |
| Crawford | - | - | 61 | 11 | 314 | 3 | 389 |
| Dane | 14 | 8 | 1,699 | 119 | 12,204 | 470 | 14,514 |
| Dodge | 8 | 2 | 312 | 41 | 1,744 | 58 | 2,165 |
| Door | 1 | 1 | 114 | 17 | 989 | 17 | 1,139 |
| Douglas | 1 | 1 | 125 | 9 | 1,232 | 70 | 1,438 |
| Dunn | 1 | 2 | 169 | 24 | 1,060 | 28 | 1,284 |
| Eau Claire | - | 4 | 398 | 10 | 3,290 | 66 | 3,768 |
| Florence | - | 1 | 14 | 2 | 77 | 5 | 99 |
| Fond du Lac | 2 | 2 | 475 | 52 | 3,753 | 125 | 4,409 |
| Forest | - | - | 15 | 3 | 130 | 6 | 154 |
| Grant | 2 | 1 | 214 | 10 | 1,527 | 56 | 1,810 |
| Green | 1 | 4 | 154 | 15 | 840 | 21 | 1,035 |
| Green Lake | 2 | - | 65 | 11 | 375 | 7 | 460 |
| Iowa | 1 | 1 | 100 | 9 | 588 | 14 | 713 |
| Iron | - | - | 12 | 4 | 98 | 3 | 117 |
| Jackson | 2 | 2 | 87 | 11 | 580 | 22 | 704 |
| Jefferson | 2 | 2 | 287 | 27 | 2,271 | 69 | 2,658 |
| Juneau | 1 | 1 | 130 | 11 | 848 | 29 | 1,020 |
| Kenosha | 4 | 6 | 1,186 | 78 | 6,615 | 197 | 8,086 |
| Kewaunee | 1 | 1 | 62 | 5 | 307 | 11 | 387 |
| La Crosse | 4 | 1 | 576 | 34 | 4,801 | 189 | 5,605 |
| Lafayette | - | 3 | 68 | 8 | 429 | 14 | 522 |
| Langlade | 1 | - | 59 | 9 | 525 | 20 | 614 |
| Lincoln | 1 | 3 | 112 | 11 | 842 | 27 | 996 |
| Manitowoc | 3 | 4 | 389 | 32 | 2,647 | 82 | 3,157 |
| Marathon | 4 | 6 | 583 | 35 | 4,181 | 111 | 4,920 |
| Marinette | 2 | 2 | 219 | 32 | 1,239 | 26 | 1,520 |
| Marquette | 3 | - | 66 | 7 | 386 | 10 | 472 |
| Menominee | - | 1 | 8 | 1 | 31 | 1 | 42 |
| Milwaukee | 6 | 22 | 6,315 | 585 | 36,738 | 2,049 | 45,715 |
| Monroe | 2 | 1 | 189 | 7 | 1,423 | 57 | 1,679 |
| Oconto | 2 | 2 | 132 | 12 | 617 | 10 | 775 |
| Oneida | - | - | 159 | 10 | 942 | 53 | 1,164 |
| Outagamie | 5 | 2 | 854 | 39 | 6,392 | 131 | 7,423 |
| Ozaukee | 1 | - | 286 | 15 | 2,361 | 52 | 2,715 |
| Pepin | - | - | 21 | 4 | 83 | 9 | 117 |
| Pierce | 1 | 3 | 77 | 14 | 615 | 30 | 740 |
| Polk | 3 | 2 | 171 | 20 | 743 | 39 | 978 |
| Portage | 1 | 5 | 282 | 19 | 2,134 | 63 | 2,504 |
| Price | - | 1 | 34 | 4 | 235 | 9 | 283 |
| Racine | 2 | - | 1,254 | 70 | 5,973 | 218 | 7,517 |
| Richland | 2 | 1 | 66 | 8 | 460 | 21 | 558 |
| Rock | 10 | 11 | 871 | 91 | 5,910 | 214 | 7,107 |
| Rusk | 1 | 2 | 38 | 4 | 216 | 8 | 269 |
| Sauk | 5 | 5 | 376 | 40 | 2,833 | 95 | 3,354 |
| Sawyer | 2 | - | 57 | 11 | 293 | 15 | 378 |
| Shawano | 2 | 3 | 187 | 24 | 1,040 | 49 | 1,305 |
| Sheboygan | 2 | 3 | 411 | 15 | 3,546 | 100 | 4,077 |
| St. Croix | 3 | 4 | 341 | 18 | 3,113 | 72 | 3,551 |
| Taylor | 3 | - | 76 | 10 | 485 | 21 | 595 |
| Trempealeau | - | 2 | 137 | 9 | 585 | 25 | 758 |
| Vernon | 2 | 1 | 81 | 4 | 496 | 21 | 605 |
| Vilas | - | - | 92 | 24 | 638 | 27 | 781 |
| Walworth | 1 | 1 | 402 | 37 | 2,753 | 90 | 3,284 |
| Washburn | - | 1 | 52 | 2 | 364 | 9 | 428 |
| Washington | 2 | 5 | 541 | 47 | 4,832 | 126 | 5,553 |
| Waukesha | 6 | 4 | 1,534 | 111 | 12,527 | 333 | 14,515 |
| Waupaca | 3 | 4 | 153 | 23 | 1,032 | 43 | 1,258 |
| Waushara | 6 | 1 | 107 | 8 | 616 | 25 | 763 |
| Winnebago | 2 | 2 | 889 | 57 | 5,536 | 177 | 6,663 |
| Wood | - | 2 | 282 | 21 | 1,824 | 57 | 2,186 |
| Total | 152 | 167 | 26,191 | 2,208 | 174,576 | 6,436 | 209,730 |
| These tables count occupants for whom seat belt use was recorded on the crash report form and whose role was not unknown. Caution: Safety equipment use for many occupants was self-reported. Therefore, these figures may overstate actual use of safety equipment. | |||||||
| Manner of Collision | Deployed | Not Deployed | Other | Total | ||||||
|---|---|---|---|---|---|---|---|---|---|---|
| Killed | Injured | No Injury | Killed | Injured | No Injury | Killed | Injured | No Injury | ||
| Front To Front | 54 | 1,356 | 1,214 | 4 | 584 | 4,529 | 2 | 25 | 184 | 7,952 |
| Front To Rear | 18 | 1,821 | 3,154 | 5 | 5,408 | 46,883 | 8 | 137 | 1,267 | 58,701 |
| Front To Side | 64 | 6,158 | 8,113 | 11 | 4,348 | 43,525 | 3 | 134 | 1,048 | 63,404 |
| No Coll W/Veh In Transport | 84 | 3,584 | 4,587 | 44 | 3,232 | 23,691 | 12 | 220 | 17,034 | 52,488 |
| Other | 2 | 97 | 135 | 3 | 62 | 1,632 | - | 12 | 135 | 2,078 |
| Rear To Rear | - | 18 | 25 | - | 74 | 2,467 | - | 10 | 302 | 2,896 |
| Rear To Side | - | 93 | 163 | - | 128 | 5,331 | - | 9 | 285 | 6,009 |
| Sideswipe/Opposite Direction | 3 | 101 | 167 | - | 108 | 1,947 | - | 6 | 159 | 2,491 |
| Sideswipe/Same Direction | 1 | 183 | 343 | 1 | 437 | 11,424 | - | 23 | 766 | 13,178 |
| Unknown | - | 19 | 17 | - | 6 | 128 | - | 6 | 357 | 533 |
| Total | 226 | 13,430 | 17,918 | 68 | 14,387 | 141,557 | 25 | 582 | 21,537 | 209,730 |
| These tables count occupants for whom seat belt use was recorded on the crash report form and whose role was not unknown. Caution: Safety equipment use for many occupants was self-reported. Therefore, these figures may overstate actual use of safety equipment. | ||||||||||
| Seat belt status | Killed | Injured | No Injury | Total | ||||||
|---|---|---|---|---|---|---|---|---|---|---|
| Not Ejected | Partially Ejected | Totally Ejected | Not Ejected | Partially Ejected | Totally Ejected | Not Ejected | Partially Ejected | Totally Ejected | ||
| Worn | 145 | 3 | 4 | 26,084 | 12 | 13 | 158,554 | 3 | 1 | 184,819 |
| Not Worn | 103 | 16 | 44 | 1,872 | 18 | 146 | 1,767 | - | 4 | 3,970 |
| Total | 248 | 19 | 48 | 27,956 | 30 | 159 | 160,321 | 3 | 5 | 188,789 |
| For definition of ejection types, see Glossary. These tables count occupants for whom seat belt use was recorded on the crash report form and whose role was not unknown. Caution: Safety equipment use for many occupants was self-reported. Therefore, these figures may overstate actual use of safety equipment. | ||||||||||
| Ejectionn path | Worn | Not Worn | Total | ||||
|---|---|---|---|---|---|---|---|
| Killed | Injured | No Injury | Killed | Injured | No Injury | ||
| Other Path (E.G., Back Of Pickup Truck, Trailer) | - | - | - | - | 5 | - | 5 |
| Through Back Door/Tailgate Opening | - | 1 | - | - | 3 | - | 4 |
| Through Back Window | - | 1 | - | 3 | 10 | - | 14 |
| Through Roof (Convertible Top Up) | - | - | - | - | - | 1 | 1 |
| Through Roof Opening (Sun Roof/Convertible Top Down) | - | - | - | 5 | 7 | 1 | 13 |
| Through Side Door Opening | 2 | 7 | - | 5 | 19 | 1 | 34 |
| Through Side Window | 1 | 3 | - | 26 | 50 | - | 80 |
| Through Windshield | - | 2 | - | 2 | 8 | 1 | 13 |
| Unknown | 4 | 9 | 1 | 19 | 62 | - | 95 |
| Total | 7 | 23 | 1 | 60 | 164 | 4 | 259 |
| These tables count occupants for whom seat belt use was recorded on the crash report form and whose role was not unknown. Caution: Safety equipment use for many occupants was self-reported. Therefore, these figures may overstate actual use of safety equipment. | |||||||
| Extricated status | Worn | Not Worn | Total | ||||
|---|---|---|---|---|---|---|---|
| Killed | Injured | No Injury | Killed | Injured | No Injury | ||
| Not Trapped | 43 | 25,010 | 158,257 | 70 | 1,842 | 1,766 | 186,988 |
| Trapped/Extricated | 86 | 932 | 205 | 69 | 178 | 6 | 1,476 |
| Trapped/Not Extricated | 23 | 173 | 105 | 25 | 26 | 5 | 357 |
| Total | 152 | 26,115 | 158,567 | 164 | 2,046 | 1,777 | 188,821 |
| For definition of entrapment/extrication types, see Glossary. If the person was killed, Trapped/Not Extricated indicates the person died in the vehicle. These tables count occupants for whom seat belt use was recorded on the crash report form and whose role was not unknown. Caution: Safety equipment use for many occupants was self-reported. Therefore, these figures may overstate actual use of safety equipment. | |||||||
8.2 Commercial Motor Vehicles: Seat Belt Use
Note
Commercial motor vehicles are made up of straight trucks and truck tractors - including trailers not attached and trailers attached.
| Seat belt | Killed | Injured | No Injury | Total | ||||||
|---|---|---|---|---|---|---|---|---|---|---|
| Driver | Passenger | Other | Driver | Passenger | Other | Driver | Passenger | Other | ||
| Shoulder & Lap Belt | 2 | 1 | - | 319 | 24 | - | 5,477 | 414 | 18 | 6,255 |
| Lap Belt Only | - | - | - | 3 | - | - | 11 | 9 | - | 23 |
| Shoulder Belt Only | - | - | - | - | - | - | 8 | - | - | 8 |
| Child Safety Seat | - | - | - | - | - | - | - | 5 | 1 | 6 |
| None | - | - | - | 22 | 7 | 4 | 184 | 43 | 207 | 467 |
| Total | 2 | 1 | - | 344 | 31 | 4 | 5,680 | 471 | 226 | 6,759 |
| A role of Other is either an occupant of motor vehicle not in transport or a pedestrian (non-occupant). These tables count occupants for whom seat belt use was recorded on the crash report form and whose role was not unknown. Caution: Safety equipment use for many occupants was self-reported. Therefore, these figures may overstate actual use of safety equipment. | ||||||||||
| Age Group | Fatal Injury | Suspected Serious Injury | Suspected Minor Injury | Possible Injury | No Apparent Injury | Total | |||||
|---|---|---|---|---|---|---|---|---|---|---|---|
| Worn | Not Worn | Worn | Not Worn | Worn | Not Worn | Worn | Not Worn | Worn | Not Worn | ||
| 0-4 | - | - | - | - | - | - | - | - | 4 | 2 | 6 |
| 5-14 | - | - | - | - | 1 | - | - | - | 18 | 4 | 23 |
| 15-24 | - | - | 2 | 1 | 16 | 1 | 9 | 1 | 456 | 20 | 506 |
| 25-34 | - | - | 6 | 1 | 32 | 2 | 16 | 3 | 1,191 | 69 | 1,320 |
| 35-44 | 1 | - | 1 | 2 | 39 | 4 | 30 | 3 | 1,210 | 74 | 1,364 |
| 45-54 | - | - | 7 | 2 | 36 | 1 | 25 | 1 | 1,316 | 82 | 1,470 |
| 55-64 | 2 | - | 12 | 1 | 49 | 5 | 29 | 1 | 1,313 | 49 | 1,461 |
| 65-74 | - | - | 5 | 1 | 14 | 2 | 10 | 1 | 362 | 14 | 409 |
| 75-84 | - | - | - | - | 4 | - | 2 | - | 63 | 1 | 70 |
| 85+ | - | - | - | - | - | - | - | - | 4 | 1 | 5 |
| Unknown | - | - | - | - | - | - | 1 | - | 6 | 118 | 125 |
| Total | 3 | - | 33 | 8 | 191 | 15 | 122 | 10 | 5,943 | 434 | 6,759 |
| These tables count occupants for whom seat belt use was recorded on the crash report form and whose role was not unknown. Caution: Safety equipment use for many occupants was self-reported. Therefore, these figures may overstate actual use of safety equipment. | |||||||||||
| Seat belt status | Killed | Injured | No Injury | Total | |||
|---|---|---|---|---|---|---|---|
| Not Ejected | Not Ejected | Partially Ejected | Totally Ejected | Not Ejected | Totally Ejected | ||
| Worn | 3 | 342 | 1 | 2 | 5,752 | - | 6,100 |
| Not Worn | - | 28 | - | 2 | 78 | 1 | 109 |
| Total | 3 | 370 | 1 | 4 | 5,830 | 1 | 6,209 |
| For definition of ejection types, see Glossary. These tables count occupants for whom seat belt use was recorded on the crash report form and whose role was not unknown. Caution: Safety equipment use for many occupants was self-reported. Therefore, these figures may overstate actual use of safety equipment. | |||||||
| Ejectionn path | Worn | Not Worn | Total | ||||
|---|---|---|---|---|---|---|---|
| Killed | Injured | No Injury | Killed | Injured | No Injury | ||
| - | - | - | - | - | - | - | - |
| Through Side Door Opening | - | - | - | - | 1 | 1 | 2 |
| Through Side Window | - | 1 | - | - | - | - | 1 |
| Through Windshield | - | - | - | - | 1 | - | 1 |
| Unknown | - | 2 | - | - | - | - | 2 |
| Total | - | 3 | - | - | 2 | 1 | 6 |
| These tables count occupants for whom seat belt use was recorded on the crash report form and whose role was not unknown. Caution: Safety equipment use for many occupants was self-reported. Therefore, these figures may overstate actual use of safety equipment. | |||||||
| Extricated status | Worn | Not Worn | Total | ||||
|---|---|---|---|---|---|---|---|
| Killed | Injured | No Injury | Killed | Injured | No Injury | ||
| - | - | - | - | - | - | - | - |
| Not Trapped | - | 302 | 5,741 | - | 27 | 79 | 6,149 |
| Trapped/Extricated | 2 | 39 | 8 | - | 3 | - | 52 |
| Trapped/Not Extricated | 1 | 5 | 2 | - | - | - | 8 |
| Total | 3 | 346 | 5,751 | - | 30 | 79 | 6,209 |
| For definition of entrapment/extrication types, see Glossary. If the person was killed, Trapped/Not Extricated indicates the person died in the vehicle. These tables count occupants for whom seat belt use was recorded on the crash report form and whose role was not unknown. Caution: Safety equipment use for many occupants was self-reported. Therefore, these figures may overstate actual use of safety equipment. | |||||||
8.3 Pedestrians: Safety Equipment Use
| Item | Fatal Injury | Suspected Serious Injury | Suspected Minor Injury | Possible Injury | No Apparent Injury | Total |
|---|---|---|---|---|---|---|
| Helmet | 1 | 2 | 5 | 1 | 1 | 10 |
| Lighting | 1 | 2 | 6 | - | - | 9 |
| None | 45 | 251 | 547 | 276 | 75 | 1,194 |
| Other | 1 | 15 | 23 | 9 | 2 | 50 |
| Protective Pads Used (Elbow, Kneeds, Shin, Etc) | - | 1 | - | 1 | - | 2 |
| Reflective Clothing (Jacket, Backpack, Etc) | 2 | 11 | 11 | 8 | 3 | 35 |
| Total | 50 | 282 | 592 | 295 | 81 | 1,300 |
8.4 Bicyclists: Safety Equipment Use
| Item | Fatal Injury | Suspected Serious Injury | Suspected Minor Injury | Possible Injury | No Apparent Injury | Total |
|---|---|---|---|---|---|---|
| Helmet | 4 | 30 | 110 | 40 | 15 | 199 |
| Lighting | 1 | 6 | 10 | 3 | 1 | 21 |
| None | 3 | 44 | 235 | 85 | 48 | 415 |
| Other | - | 4 | 11 | 4 | 4 | 23 |
| Protective Pads Used (Elbow, Kneeds, Shin, Etc) | - | - | 9 | 3 | - | 12 |
| Reflective Clothing (Jacket, Backpack, Etc) | 3 | 3 | 15 | 6 | 3 | 30 |
| Total | 11 | 87 | 390 | 141 | 71 | 700 |
8.5 Motorcyclists: Helmet and Protective Gear Use
Note
Moped users are not counted as a motorcyclist. Motorcyclists includes both drivers and passengers.
| Helmet Status | Fatal Injury | Suspected Serious Injury | Suspected Minor Injury | Possible Injury | No Apparent Injury | Total | ||||||||
|---|---|---|---|---|---|---|---|---|---|---|---|---|---|---|
| Driver | Passenger | Driver | Passenger | Driver | Occupant Of Motor Vehicle Not In Transport | Passenger | Driver | Occupant Of Motor Vehicle Not In Transport | Passenger | Driver | Occupant Of Motor Vehicle Not In Transport | Passenger | ||
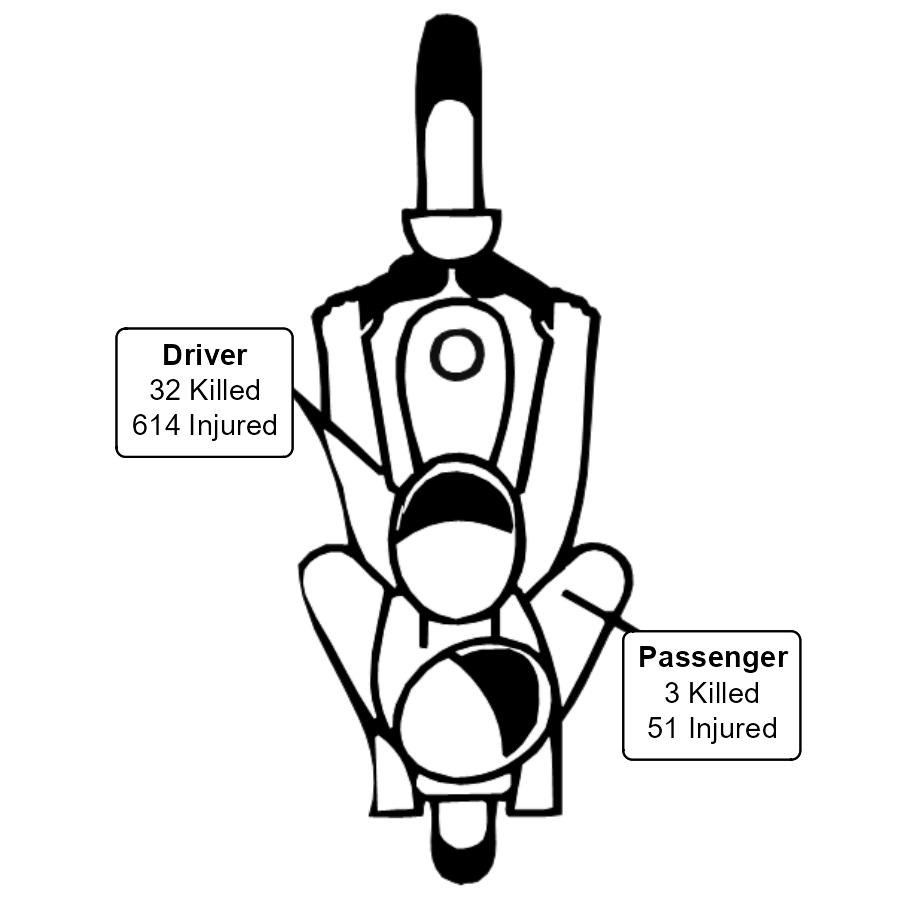
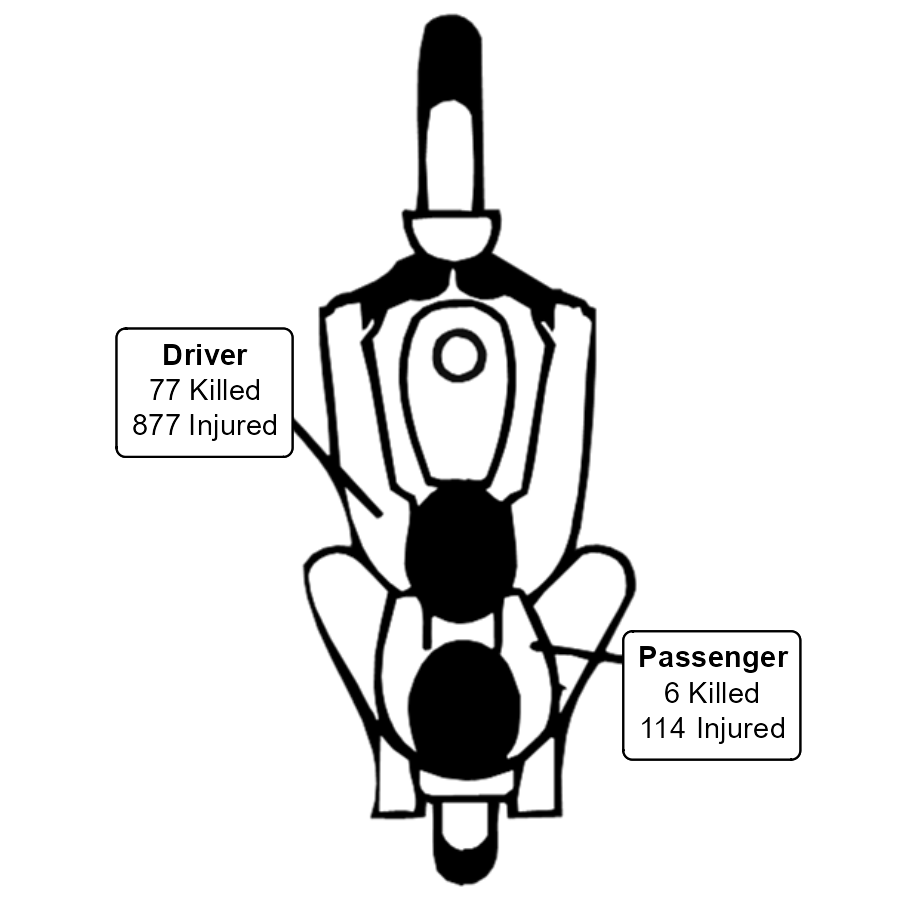
| Helmet Not Worn | 77 | 6 | 378 | 36 | 404 | - | 67 | 95 | 1 | 11 | 182 | 1 | 27 | 1,285 |
| Helmet Worn | 32 | 3 | 177 | 13 | 360 | 2 | 29 | 77 | - | 9 | 159 | - | 14 | 875 |
| Total | 109 | 9 | 555 | 49 | 764 | 2 | 96 | 172 | 1 | 20 | 341 | 1 | 41 | 2,160 |
| These numbers include only motorcyclists whose helmet use was reported on the crash report form. Helmet use is often self-reported and may not reflect actual use. | ||||||||||||||
| Age Group | Fatal Injury | Suspected Serious Injury | Suspected Minor Injury | Possible Injury | No Apparent Injury | Total | |||||
|---|---|---|---|---|---|---|---|---|---|---|---|
| Helmet Not Worn | Helmet Worn | Helmet Not Worn | Helmet Worn | Helmet Not Worn | Helmet Worn | Helmet Not Worn | Helmet Worn | Helmet Not Worn | Helmet Worn | ||
| 0-4 | - | - | - | - | - | - | - | - | - | - | - |
| 5-14 | - | 1 | 1 | 1 | - | 4 | - | 1 | 1 | 2 | 11 |
| 15-24 | 1 | 9 | 38 | 46 | 44 | 90 | 13 | 18 | 19 | 41 | 319 |
| 25-34 | 12 | 7 | 97 | 38 | 109 | 75 | 17 | 17 | 33 | 42 | 447 |
| 35-44 | 15 | 5 | 72 | 25 | 96 | 60 | 15 | 18 | 40 | 27 | 373 |
| 45-54 | 23 | 3 | 91 | 32 | 86 | 46 | 36 | 14 | 53 | 18 | 402 |
| 55-64 | 23 | 5 | 83 | 31 | 97 | 68 | 22 | 9 | 42 | 20 | 400 |
| 65-74 | 7 | 3 | 32 | 14 | 35 | 40 | 4 | 5 | 13 | 18 | 171 |
| 75-84 | 2 | 2 | - | 3 | 3 | 8 | - | 2 | 3 | 1 | 24 |
| 85+ | - | - | - | - | 1 | - | - | - | - | - | 1 |
| Unknown | - | - | - | - | - | - | - | 2 | 6 | 4 | 12 |
| Total | 83 | 35 | 414 | 190 | 471 | 391 | 107 | 86 | 210 | 173 | 2,160 |
| These numbers include only motorcyclists whose helmet use was reported on the crash report form. Helmet use is often self-reported and may not reflect actual use. | |||||||||||
| Helmet Type | Fatal Injury | Suspected Serious Injury | Suspected Minor Injury | Possible Injury | No Apparent Injury | Total |
|---|---|---|---|---|---|---|
| Full-Face | 25 | 138 | 279 | 63 | 124 | 629 |
| Half | 5 | 28 | 63 | 16 | 27 | 139 |
| Three-Quarter | 5 | 24 | 49 | 7 | 22 | 107 |
| Total | 35 | 190 | 391 | 86 | 173 | 875 |
| These numbers include only motorcyclists whose helmet use was reported on the crash report form. Helmet use is often self-reported and may not reflect actual use. | ||||||
| Helmet Type | Fatal Injury | Suspected Serious Injury | Suspected Minor Injury | Possible Injury | No Apparent Injury | Total |
|---|---|---|---|---|---|---|
| Approved | 27 | 134 | 312 | 70 | 132 | 675 |
| Non Approved | - | - | 1 | 1 | 1 | 3 |
| Unknown | 8 | 56 | 78 | 15 | 40 | 197 |
| Total | 35 | 190 | 391 | 86 | 173 | 875 |
| These numbers include only motorcyclists whose helmet use was reported on the crash report form. Helmet use is often self-reported and may not reflect actual use. | ||||||
| Helmet Type | Fatal Injury | Suspected Serious Injury | Suspected Minor Injury | Possible Injury | No Apparent Injury | Total |
|---|---|---|---|---|---|---|
| No | - | 6 | 12 | 3 | 8 | 29 |
| Unknown | 23 | 120 | 206 | 42 | 83 | 474 |
| Yes | 12 | 64 | 173 | 41 | 82 | 372 |
| Total | 35 | 190 | 391 | 86 | 173 | 875 |
| These numbers include only motorcyclists whose helmet use was reported on the crash report form. Helmet use is often self-reported and may not reflect actual use. | ||||||
| Protective Gear | Fatal Injury | Suspected Serious Injury | Suspected Minor Injury | Possible Injury | No Apparent Injury | Total |
|---|---|---|---|---|---|---|
| Boots | 28 | 201 | 302 | 64 | 163 | 758 |
| Gloves | 26 | 127 | 200 | 48 | 107 | 508 |
| Jacket | 37 | 214 | 286 | 75 | 163 | 775 |
| Long Pants | 58 | 306 | 489 | 98 | 226 | 1,177 |
| None | 36 | 204 | 266 | 69 | 101 | 676 |
| Reflective | 1 | 9 | 26 | 7 | 18 | 61 |
| Unknown | 11 | 65 | 71 | 24 | 88 | 259 |
| A motorcyclist may wear one or more protective gear. | ||||||
| Eye Protection | Helmet Not Worn | Helmet Worn | Total | ||||||||
|---|---|---|---|---|---|---|---|---|---|---|---|
| Fatal Injury | Suspected Serious Injury | Suspected Minor Injury | Possible Injury | No Apparent Injury | Fatal Injury | Suspected Serious Injury | Suspected Minor Injury | Possible Injury | No Apparent Injury | ||
| No | 13 | 105 | 111 | 31 | 49 | 2 | 8 | 19 | 7 | 4 | 349 |
| Unknown | 35 | 118 | 59 | 11 | 24 | 9 | 42 | 50 | 13 | 14 | 375 |
| Yes: Windshield | 7 | 28 | 36 | 9 | 17 | 11 | 27 | 75 | 20 | 29 | 259 |
| Yes: Worn | 20 | 126 | 206 | 38 | 92 | 10 | 66 | 163 | 32 | 89 | 842 |
| Yes: Worn and Windshield | 8 | 37 | 59 | 18 | 28 | 3 | 47 | 84 | 14 | 37 | 335 |
| Total | 83 | 414 | 471 | 107 | 210 | 35 | 190 | 391 | 86 | 173 | 2,160 |
| These numbers include only motorcyclists whose helmet use was reported on the crash report form. Helmet use is often self-reported and may not reflect actual use. | |||||||||||
| Helmet Type | Fatal Injury | Suspected Serious Injury | Suspected Minor Injury | Possible Injury | No Apparent Injury | Total | ||||||
|---|---|---|---|---|---|---|---|---|---|---|---|---|
| Driver | Passenger | Driver | Passenger | Driver | Occupant Of Motor Vehicle Not In Transport | Passenger | Driver | Passenger | Driver | Passenger | ||
| Full-Face | 24 | 1 | 132 | 6 | 259 | 2 | 18 | 57 | 6 | 116 | 8 | 629 |
| Half | 5 | - | 24 | 4 | 56 | - | 7 | 15 | 1 | 25 | 2 | 139 |
| Three-Quarter | 3 | 2 | 21 | 3 | 45 | - | 4 | 5 | 2 | 18 | 4 | 107 |
| Total | 32 | 3 | 177 | 13 | 360 | 2 | 29 | 77 | 9 | 159 | 14 | 875 |
| These numbers include only motorcyclists whose helmet use was reported on the crash report form. Helmet use is often self-reported and may not reflect actual use. | ||||||||||||